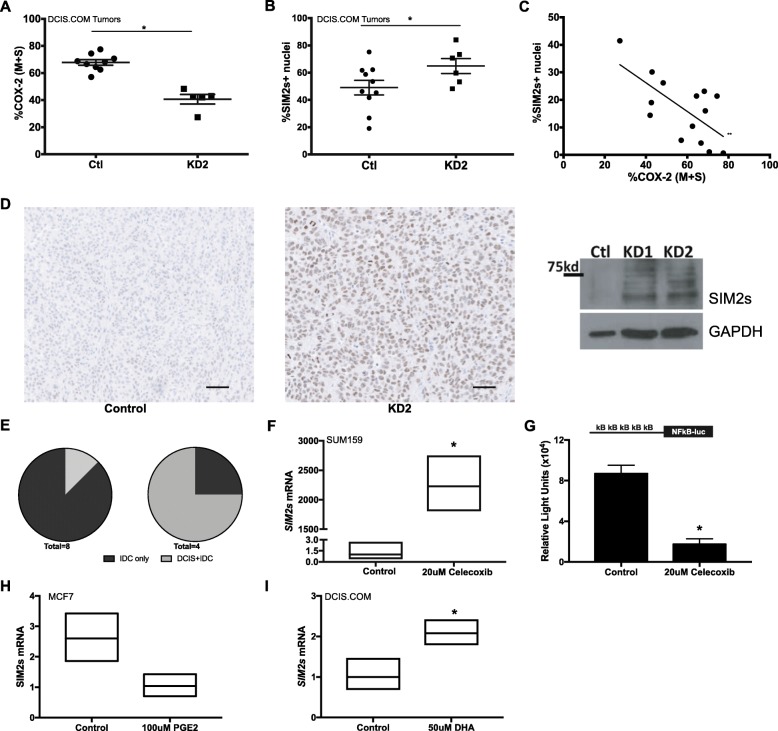
Fig. 4.
a IHC analysis for COX-2 positive nuclei in tumors generated from control (Ctl) and shPTGS2 (KD2) DCIS.COM cells. Prism7 was utilized for statistical significance. Unpaired t test, *p value < 0.02. b IHC analysis for SIM2s positive nuclei in tumors generated from control (Ctl) and shPTGS2 (KD2) DCIS.com cells. Prism7 was utilized for statistical significance. Unpaired t test, *p value < 0.0001. c Correlation data for SIM2s and COX-2 positive nuclei in tumors generated from control and shPTGS2 DCIS.com cells. Prism7 was utilized for statistical significance. Unpaired t test, **p value < 0.01. d Images of IHC analysis for SIM2s in tumors generated from control and shPTGS2 DCIS.COM cells (left); DCIS.COM control, shPTGS2 (KD1), and shPTGS2 (KD2) were analyzed by western blot for SIM2s and GAPDH as loading control (right). e Pie Chart to show percent tumor progression DCIS+IDC or IDC only in the control group (n = 8) and shPTGS2 (n = 4). f SIM2s expression in SUM159 control cells and cells dosed with 20 μM celecoxib by qPCR as fold change. g SIM2s expression in DCIS.COM control cells and cells dosed with 50 μM DHA by qPCR as fold change. h SIM2s expression in MCF7 cells dosed with vehicle or 100 μM PGE2 for 24 h by qPCR, unpaired t test: p < 0.08. i SIM2s expression in DCIS.COM cells treated with vehicle (control) or 50 μM DHA by qPCR. Unpaired t test: *p < 0.05

