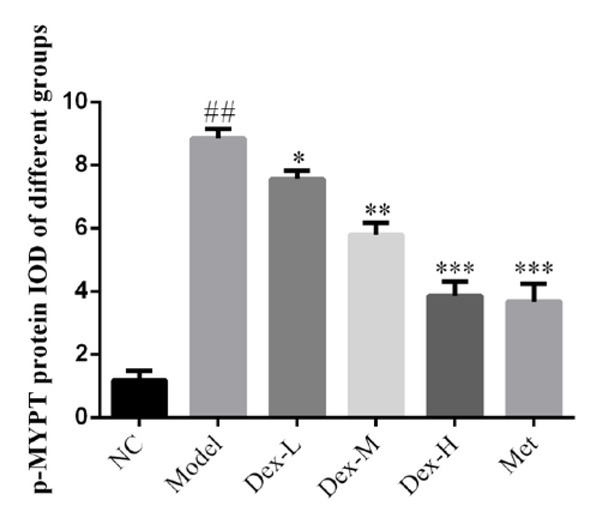
Figure 7.

Comparison of p-MYPT protein expression in Kidney of Rats in Each Group
NC: normal control group; Model: DN model group; Dex-L: Dex low-dose treated group; Dex-M: Dex medium-dose treated group; Dex-H: Dex high-dose treated group; Met: Metformin treated group
##: P<0.01, compared with NC group; *: P<0.05, **: P<0.01***, P<0.001, compared with Model group
