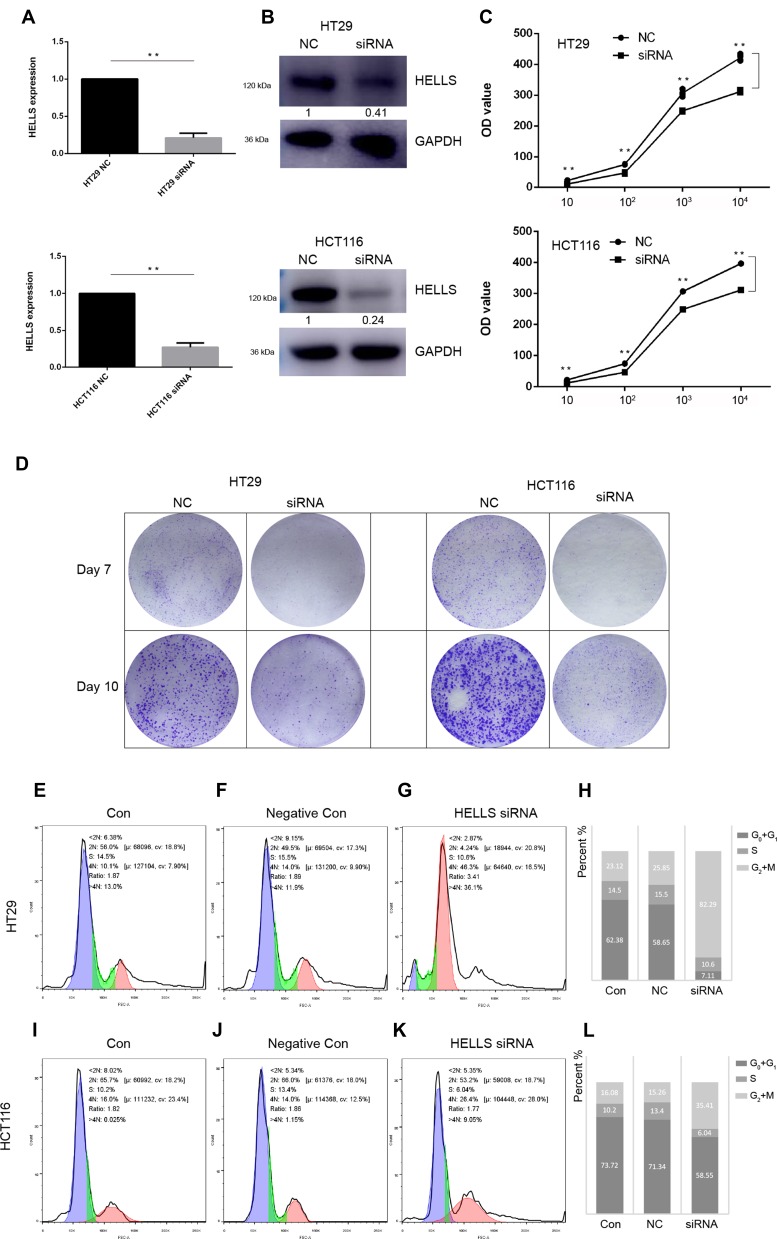
Figure 4.
HELLS functions in proliferation, colony generation and the cell cycle in colorectal cancer cells. (A, B) qRT-PCR and Western blotting were used to determine whether siRNA successfully decreased HELLS expression at the RNA and protein levels, respectively. **p < 0.01. (C) Cell proliferation after siRNA transfection was significantly decreased in HT29 cells and HCT116 cells, as determined by CCK-8 assay. The initial cell density was 10, 102, 103, and 104 cells per well. The cells were cultured for 3 days before the CCK-8 assay was performed. **p < 0.01. (D) Results from the colony generation assay for the HELLS siRNA cells and the negative control (NC) cells. After the first transfection, siRNA or NC was added on Day 3. (E–G) and (I–K). The cell cycle status after transfection of the HELLS siRNA was tested by flow cytometry of cells stained by PI. (H) and (L) Quantification of each stage is shown in the stacked histogram. In HT29, 82.29% of the HELLS siRNA cells were in G2+M, and 23.12% and 25.85% in control and negative control cells. In HCT116, 35.41% of the transfectants were in G2+M, and only 16.08% and 15.26% of control and negative control cells in G2+M.

