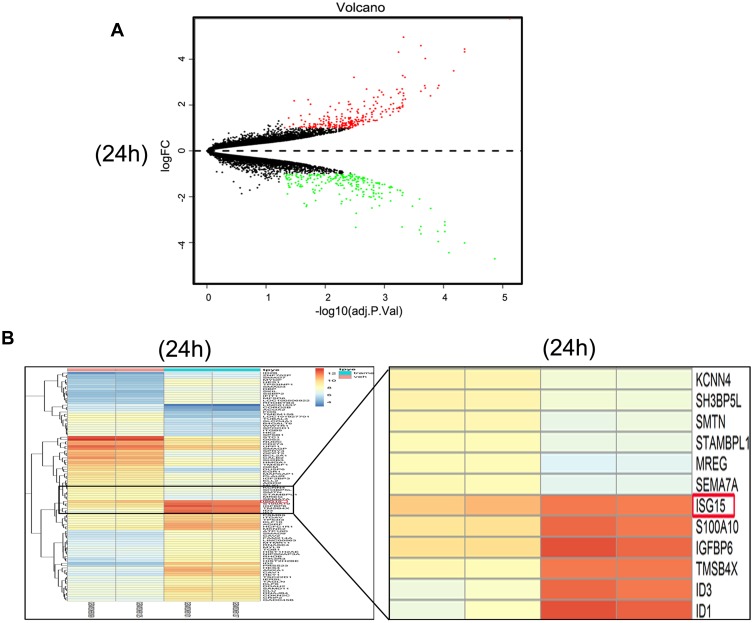
Figure 3.
Trametinib treatment activates the expression of ISG15 as shown by the identification of DEGs. (A) Volcanoplot of the 193 identified DEGs at 24 hrs. Red indicates DEGs with a |log2FC|>1.5. DEG, differentially expressed gene; FC, fold change. (B) Heat map showing the 193 differentially expressed genes betweenthe trametinib (n=2) and control groups at 24 hrs. (n=2; >1.5-fold, p<0.05). The most highly upregulated (red) and downregulated (green) genes in the trametinib group are listed.

