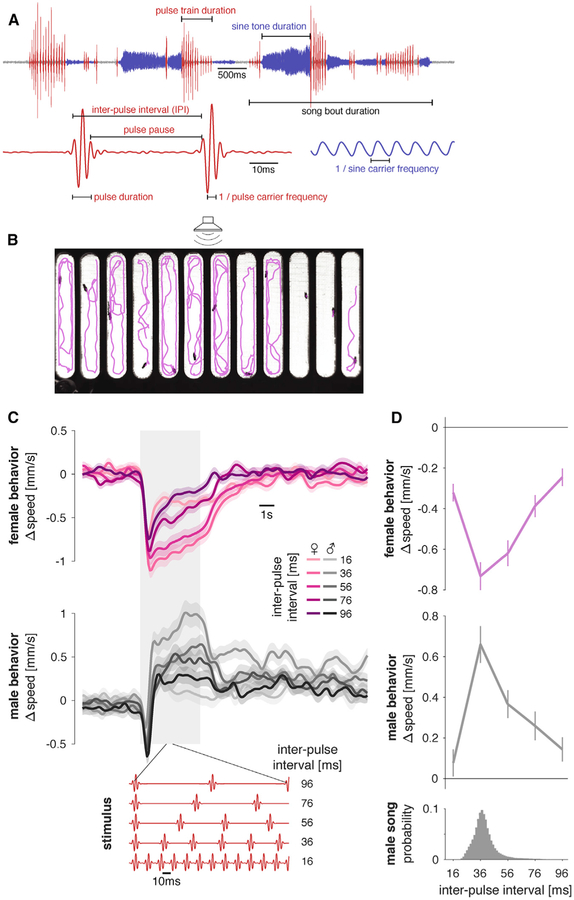
Figure 1. FLyTRAP Assay for Comparing Locomotor Tuning for Courtship Song Stimuli in Males and Females.
(A) Drosophila melanogaster produces song in bouts that can consist of two modes: sine song corresponds to a weakly amplitude modulated oscillation with a species-specific carrier frequency (~150 Hz) and pulse song corresponds to trains of Gabor-like wavelets each with a carrier frequency between 220 and 450 Hz and a duration between 6 and 12 ms. These pulses are produced at an inter-pulse interval (IPI) of 30–45 ms.
(B) FLyTRAP consists of a behavioral chamber that is placed in front of a speaker through which sound is presented. Fly movement is tracked using a camera. Shown is a single video frame of females in the assay with fly tracks for the preceding 20 s overlaid in magenta. See Video S1.
(C) Locomotor responses of females (magenta) and males (gray) for pulse trains with different IPIs (see legend). The gray shaded box indicates the duration of the sound stimulus. Red traces at the bottom of the plot show short snippets of five of the stimuli presented in this experiment. The baseline speed was subtracted before trial averaging.
(D) Speed tuning curves for different IPIs in females (magenta) and males (gray) are obtained by averaging the speed traces in the 6 s following stimulus onset. The histogram at bottom shows the IPI distribution found in male song (data from 47 males of NM91 wild-type strain totaling 82,643 pulses).
Lines and shaded areas or error bars in (C) and (D) correspond to the mean ± SEM across 112 male and 112 female flies. All Δspeed values from the wild-type strain NM91. See also Figure S1, Video S1, and Table S1.

