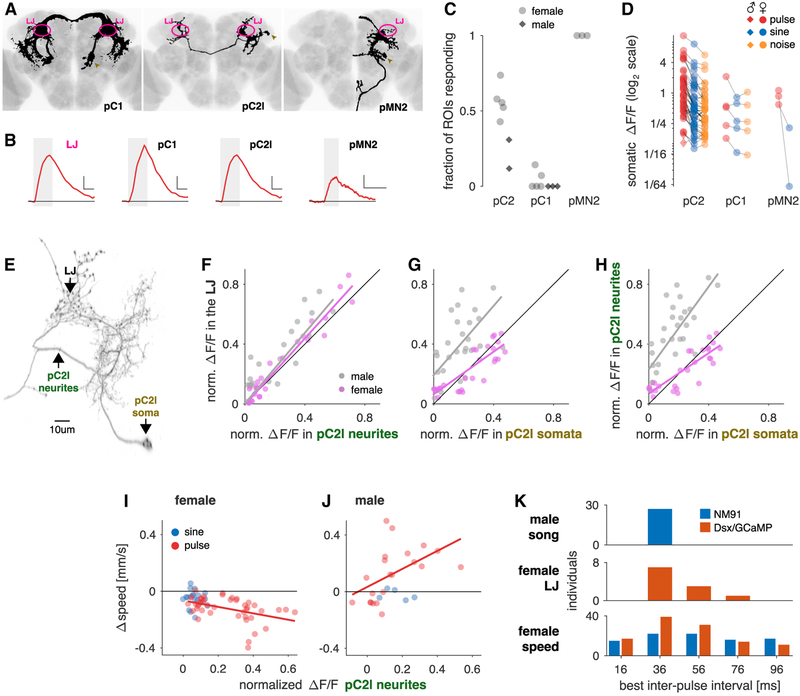
Figure 4. pC2 Neurons Are Pulse Song Detectors Common to Both Sexes.
(A) Individual Dsx+ neuron types (black) with somas in the female central brain in which we detected calcium responses for pulse or sine song, registered to a common template brain (gray) (see STAR Methods for details). Of the 8 Dsx+ cell types in the central brain, pC2l, pC2m, the single female-only neuron pMN2, and a small number of pC1 neurons (and only in some individuals) respond to courtship sounds. The LJ is marked in magenta, and somata are marked with golden arrowheads.
(B) Example somatic fluorescence traces from single somata of the pC1, pC2, and pMN2 cells in response to pulse trains (IPI = 36 ms, single trial responses). Fluorescence trace from the LJ (magenta) shown for comparison. The gray box marks the duration of the sound stimulus. In each panel, horizontal and vertical scale bars correspond to 6 s and 0.25 ΔF/F, respectively. Horizontal black line marks ΔF/F = 0.
(C) Fraction of cells in Dsx+ clusters with detectable somatic calcium responses to pulse or sine song (females, light gray dots; males, dark gray squares; each dot is the fraction per fly). Complete clusters were imaged using volumetric scan for pC1, pC2, and single plane scans for pMN2. We did not distinguish between pC2l/m, since in most flies both groups are spatially intermingled at the level of cell bodies. Note that all flies included showed calcium responses to sound in the LJ, even when we did not detect responses in specific somata.
(D) Peak somatic ΔF/F for pulse (red, 36 ms IPI), sine (blue, 150 Hz), and noise (orange, 100–900 Hz). Dots correspond to the trial average for each fly. Lines connect responses recorded in the same animal. Note that responses are plotted on a log scale—the average of the ratio between sine and pulse for all cells is ~2.6. 36/38 pC2, 4/5 pC1, and 2/2 pMN2 prefer pulse over sine. See also Video S4.
(E) High-resolution confocal scan of a single pC2l neuron (obtained via a stochastic labeling technique, see STAR Methods for details). Only the side ipsilateral to the cell body is shown. The neurites in the LJ appear varicose, indicating that they contain pre-synaptic sites.
(F) Normalized integral ΔF/F values recorded simultaneously in the LJ, and the neurites that connect the LJ with the somata of pC2l (and no other Dsx+ cell type) are highly correlated in females (magenta, r = 0.99, p = 1 × 10−71, n = 10–24 flies/stimulus) and males (gray, r = 0.75, p = 4 × 10⁻¹³, n = 1–6 flies/stimulus). Each point corresponds to an individual stimulus (pulse or sine) averaged over flies. The high correlation indicates that calcium responses in the LJ reflect responses in pC2l neurons. Magenta and gray lines in (F)–(H) correspond to a least-squares fit to the individual data points.
(G) Normalized integral ΔF/F recorded first in the LJ and then in single pC2l somata in the same fly are highly correlated in both sexes (females: r = 0.86, p = 8 × 10⁻¹⁰, n = 8 flies/stimulus, males: r = 0.73, p = 4 × 10⁻⁶, n = 1 fly/stimulus), demonstrating that calcium responses in the LJ represent the responses of individual pC2l cells, with some variability across individual cells and animals.
(H) Normalized integral ΔF/F responses from the pC2l neurites and from single pC2l somata in different flies are highly correlated in both sexes (females: r = 0.89, p = 2 × 10⁻¹¹, n = 8 flies/stimulus, males: r = 0.79, p = 1 × 10⁻⁷, n = 1 fly/stimulus). The pC2l neurites reflect the average activity of individual pC2l neurons, with some variability across individual cells and animals.
(I and J) Comparison of calcium responses in the pC2l neurites and male (I) or female (J) speed for the same stimuli. Calcium and speed data come from different flies of the same genotype (Dsx/GCaMP). Similar results were obtained when using speed data from wild-type flies (NM91) instead (Figures S4G and S4H). pC2l and behavioral responses are highly correlated for pulse with a sex-specific sign (female, I: pulse: r = −0.49, p = 1 × 10⁻³, sine: r = −0.09, p = 0.73; male, J: pulse: r = 0.70, p = 5 × 10⁻⁴, sine: r = −0.20, p = 0.78), just as for the LJ (cf. Figure 3I). The match between neuronal and behavioral tuning for pulse song indicates that pC2l neurons detect the pulse song. Each point corresponds to the average response to an individual pulse or sine stimulus (Δspeed: n ~ 100 flies per stimulus, ΔF/F: n = 10–24 female and 1–6 male flies/stimulus).
(K) Comparison across individuals of most frequent IPIs in male song (n = 75,528 pulses from 27 males) and preferred IPIs in the female LJ (integral ΔF/F; n = 11 females) and behavior (Δspeed; n = 112 females NM91 and 92 females Dsx/GCaMP). Song and speed are shown for NM91 (blue); LJ and speed are shown for Dsx/GCaMP (orange). While all males produce songs with IPIs around 36 ms, female neuronal and behavioral tuning for IPI is much more variable (SDs: 2.4 ms for male song, 14 ms for female ΔF/F [for integral ΔF/F (shown), 7 ms for peak ΔF/F], 23 and 27 ms for the speed of NM91 and Dsx/GCaMP females, respectively). Notably, variability in female speed is larger than in the female LJ, indicating that pathways parallel to or downstream of the LJ contribute to the behavior.
All Δspeed and ΔF/F values are from flies expressing GCaMP6m under the control of Dsx-Gal4 and were measured in separate individuals. All correlation values are Spearman’s rank correlation. See also Figure S4, Video S4, and Table S1.

