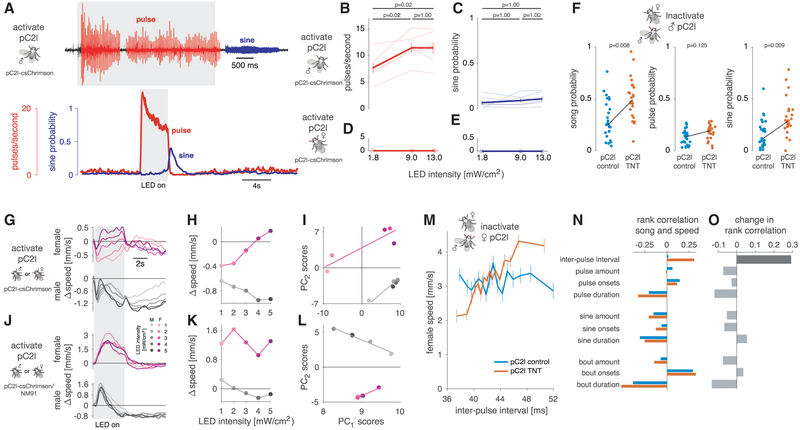
Figure 5. Testing the Necessity and Sufficiency of pC2 Neurons for Song and Locomotor Behaviors.
(A) Song evoked in males by optogenetic activation (627 nm LEDs, intensity 13 mW/cm2) of a driver line that labels pC2l and pCd neurons (R42B01∩Dsx, referred to as pC2l-csChrimson). Top trace shows a song recording marking pulse and sine song in red and blue, respectively. The gray area indicates the duration (4 s) of optogenetic activation. Pulse song is evoked during activation while sine song occurs immediately following activation. Bottom plots show pulse rate (red) and sine song probability (blue) averaged over 7 flies (18 stimulation epochs per animals). See Video S5. Activation of pC2l using a different genotype (pC2l-csChrimson/NM91) has similar effects (Figures S6A and S6B)
(B and C) Average pulse rate (B) and sine song probability (C) evoked in the 6 s following LED light onset (LED duration is 4 s). Dose-response curves for individuals are shown as thin lines; population averages (mean ± SEM) are shown as thick lines with error bars. p values result from two-sided sign tests and are adjusted for multiple comparisons using Bonferroni’s method. Same data as in (A) are shown.
(D and E) Same as (B) and (C) but for females (n = 3 flies). Activation of pC2l (and pCd) in the female does not evoke song—pC2l activation drives singing in a sex-specific manner
(F) Song of males courting wild-type NM91 females. pC2l synaptic output in the males was inhibited using TNT via the R42B01XDsx driver. Dots correspond to the amount of all song (left), pulse song (middle), and sine song (right) per fly (pC2l TNT (n = 24)—orange, pC2l control (n = 25)—blue). Black lines connect the means of the two genotypes. p values show the outcome of a two-sided rank-sum test. Inhibiting pC2l output leads to more overall singing and sine song, but not to more pulse song, indicating that pC2l biases singing toward pulse song during courtship. Other song features are not affected (see Figures S5F and S5G). (G and H) Optogenetic activation of R42B01∩Dsx using csChrimson (pC2l-csChrimson) evokes locomotor responses with sex-specific dynamics. Changes in speed (G) and tuning curves (H) were corrected for intrinsic light responses by subtracting the responses of control flies with the same genotype that were not fed retinal (see Figure S6A). Females (top, magenta) slow for weak and speed for strong activation with multi-phasic dynamics. Males decrease their speed and responses outlast the optogenetic stimulus (bottom, gray). See Figure S6A for n flies. The gray area indicates the duration of LED stimulation (4 s).
(I) Principal-component analysis (PCA) of male and female locomotor speed traces (12 s following stimulus LED or sound onset, traces taken from G). Shown are first and second principal-component (PC) scores of females (magenta) and males (gray) for sound (squares) and optogenetic stimulation (circles). Lines correspond to linear fits for each sex. Female and male responses to different LED occupy different areas in PC space, indicating that the locomotor dynamics are sex specific.
(J and K) Same as (G) and (H) but with a different genotype (pC2l-csChrimson/NM91—see STAR Methods for details). Females (top, magenta) speed throughout the stimulation (J) and for all LED intensities (K). Males (bottom, gray) first speed and then slow for all LED intensities. The evoked locomotor dynamics differ between genotypes (I) but are always sex specific.
(L) Same as (I) but with the pC2l-csChrimson/NM91 phenotype. Again, male and female locomotor responses are different, since they occupy different regions in PC space (compare [I]).
(M) Locomotor tuning for inter-pulse interval during natural courtship obtained from single females that were courted by a wild-type NM91 male. pC2l synaptic output in the females was inhibited with TNT using the R42B01Dsx driver. Lines and error bars correspond to the mean ± SEM speed over 48 females per genotype tested (pC2l TNT–orange, pC2l control – blue, see methods for details on how the tuning curves were computed). pC2l control females (blue) do not change their speed with IPI within the range commonly produced by males (r = 0.02, p = 0.59, compare Figure 1D). pC2l TNT females (orange) accelerate for longer IPIs (r = 0.31, p = 3×10–30).
(N) Rank correlation between female speed and different song features during natural courtship (pC2l control – blue, pC2l TNT – orange).
(O) Difference between the rank correlations for control (blue) and pC2l TNT (orange) flies in (N). pC2l inactivation specifically changes the correlation between female speed and IPI (dark gray, p = 6×10⁻⁸). All other changes in correlation are much smaller and not significant (p > 0.18). p values were obtained by fitting an ANCOVA model (see methods for details) and were corrected for multiple comparisons using the Bonferroni method. All correlation values are Spearman’s rank correlation. See also Figure S5 and Video S5.

