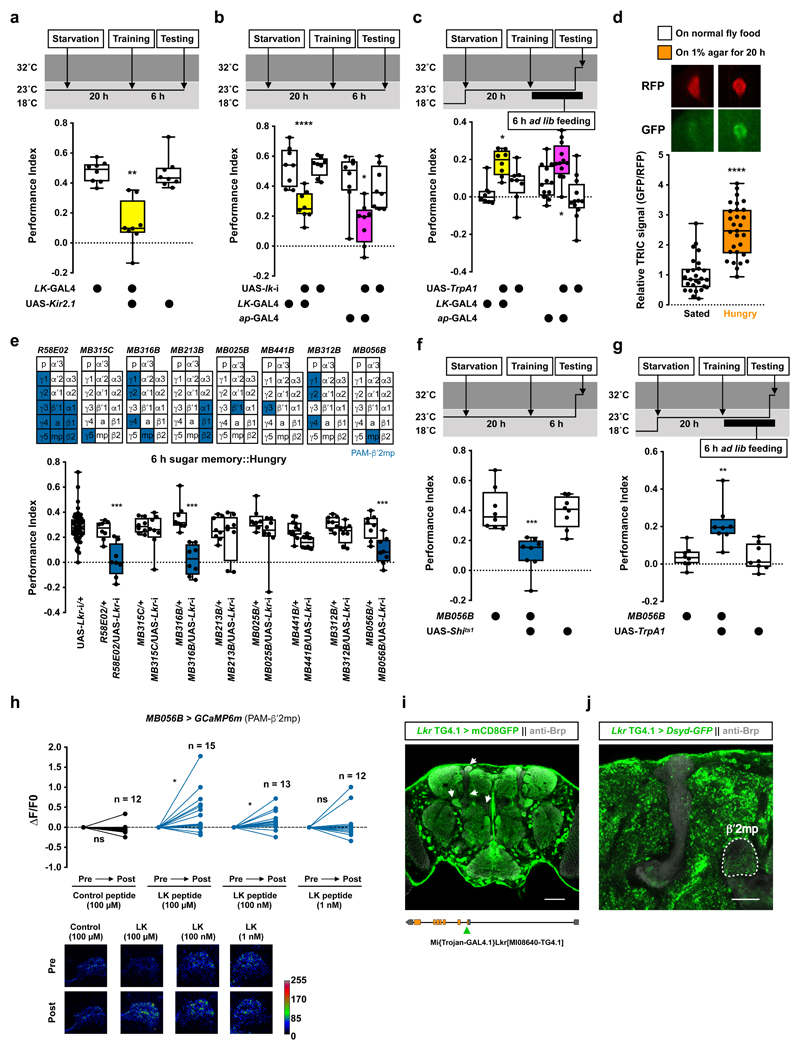
Figure 4. Leucokinin regulates hunger-dependent sugar memory expression via other dopaminergic neurons.
a, Silencing LK neurons with UAS-Kir2.1 impairs 6 h sugar memory performance in hungry flies (p<0.0045, n = 8; Kruskal-Wallis test with Dunn’s multiple comparisons test). b, RNAi knockdown of lk in all LK neurons (LK-GAL4) or LHLK neurons (ap-GAL4) impairs 6 h sugar memory performance in hungry flies (LK-GAL4: p<0.0001, n = 8; one-way ANOVA with Tukey’s test. ap-GAL4: p<0.045, n = 8; Kruskal-Wallis test with Dunn’s multiple comparisons test). c, Activating LHLK neurons with LK-GAL4 or ap-GAL4 driven UAS-TrpA1 10 min before and during testing enhances sugar memory performance in fed flies (LK-GAL4: p<0.025; ap-GAL4: p<0.035; n = 12; one-way ANOVA with Tukey’s test). d, LHLK neuron TRIC signal is increased following 20 h starvation (p<0.0001, n = 27 for Sated group and n = 29 for Hungry group; two-tailed unpaired t-test with Welch’s correction). Representative TRIC images shown above the plot. e, RNAi knockdown of Lkr in specific subsets of PAM DANs reveals PAM-β′2mp DANs (R58E02-GAL4, MB316B-splitGAL4, MB056B-splitGAL4) as critical for sugar memory expression (p<0.002, n = 8; one-way ANOVA with Tukey’s test). Diagrams above the plot depict MB innervation of DANs labeled by each GAL4. f, Blocking PAM-β′2mp DANs (MB056B-splitGAL4; UAS-Shits1) 20 min before and during testing impairs 6 h sugar memory in hungry flies (p<0.0006, n = 8; one-way ANOVA with Tukey’s test). g, Activation of PAM-β′2mp DANs (MB056B-splitGAL4; UAS-TrpA1) 10 min before and during testing enhances 6 h sugar memory in fed flies (p<0.0065, n = 8; Kruskal-Wallis test with Dunn’s multiple comparisons test). Temperature regimens shown above a-c and f-g. Box-plots: center line indicates median; box limits, upper and lower quartiles; whiskers, max to min range; dots, individual data points. h, Incubating explant brains with 100 μM or 100 nM, but not 1 nM LK or control peptide, increases GCaMP6m signal in PAM-β′2mp (MB056B-splitGAL4) DANs (Control peptide: p=0.2972, n = 12; 100 μM LK: p=0.0194, n = 15; 100 nM LK: p=0.0323, n = 13; 1 nM LK: p=0.4875, n = 12; two-tailed paired t-test). Representative images of GCaMP6m signal shown below the plot. See Supplementary Table 3 for statistics details. i, Adult brain expression of UAS-mCD8::GFP driven by Lkr Trojan-GAL4 (putative Lkr expressing neurons, green). Counterstained with anti-Brp antibody (gray). Single confocal plane is shown. Arrows indicate labeled neurites within the MB lobes. Four brains were examined and show the same expression pattern. Illustration below indicates position of Trojan-GAL4 insertion in the fly genome. Scale bar 50 μm. j, Adult brain expression of the presynaptic marker UAS-Dsyd-GFP (green) driven by Lkr Trojan-GAL4. Counterstained with anti-Brp antibody (gray). Single confocal plane is shown indicating innervation of the β′2mp zone (outlined in white). Four brains were examined and show the same expression pattern. Scale bar 20 μm.

