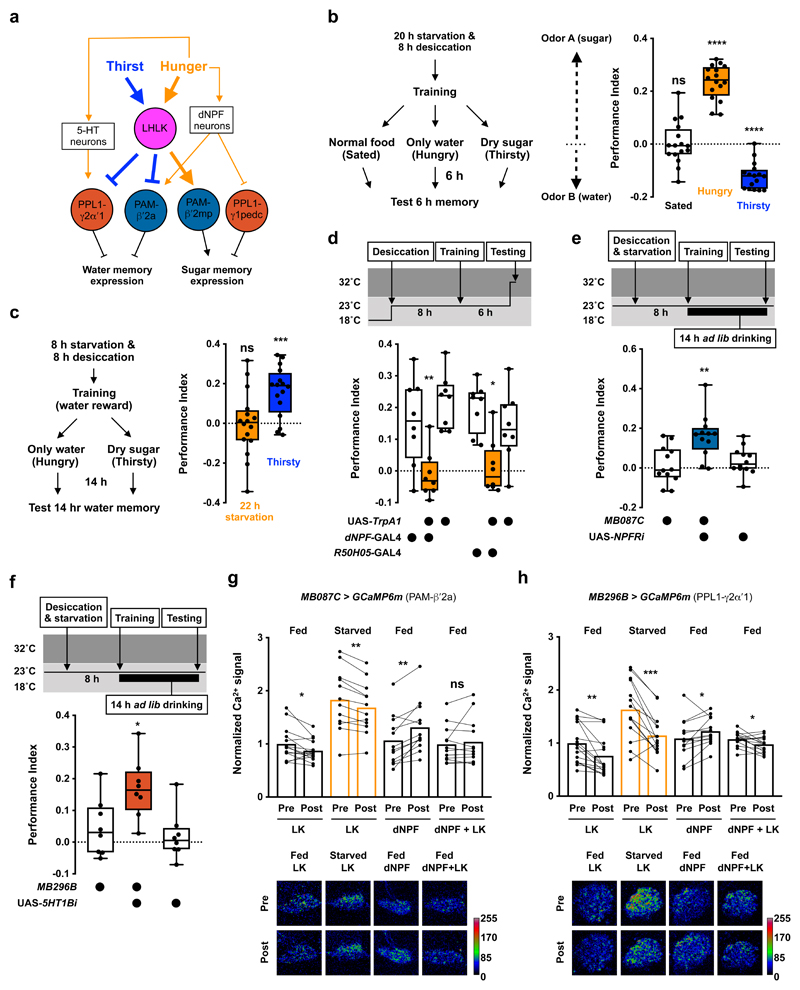
Figure 5. Dopaminergic neurons control state-appropriate memory expression by integrating LK and other hunger signals.
a, Model for how leucokinin mediates thirst and hunger control of memory expression. Dehydration and prolonged starvation increase LK release from LHLK neurons. LK inhibits PPL1-γ2α′1 and PAM-β′2a DANs and activates PAM-β′2mp DANs. PPL1-γ2α′1 and PAM-β′2a DANs work together to limit water memory expression, whereas PAM-β′2mp DANs positively regulates sugar memory expression. Other hunger signals, such as dNPF and serotonin, are known to activate PPL1-γ2α′1 and PAM-β′2a and inhibit PPL1-γ1pedc DANs7,42,43. Hunger and thirst signals compete to allow the dopaminergic system to select expression of the appropriate sugar or water memory. b, Left, experimental procedure. Flies that were both hungry and thirsty were trained to associate odor A with sugar and another odor B with water. After training, flies were given normal fly food (fully-sated), 1% agar (hungry), or dry sugar-coated filter paper (thirsty) and tested for 6 h memory. Sated flies showed no odor preference (p=0.8932, n = 16, two-tailed one sample t-test), hungry flies approached the sugar-associated odor (p<0.0001, n = 16, two-tailed one sample t-test) and thirsty flies preferred the water-associated odor (p<0.0001, n = 16, two-tailed one sample t-test). c, Left, experimental protocol. Flies starved and desiccated for 8 h were trained with water reward. After training, flies were transferred to 1% agar (hungry) or vials with dry sugar-coated paper (thirsty), before testing 14 h memory. Thirsty, but not hungry, flies expressed 14 h memory (hungry: p=0.9714, n = 16; thirsty: p=0.0002, n = 16; two-tailed one sample t-test). d, Activating dNPF neurons (dNPF-GAL4) or hunger-promoting 5-HT neurons (R50H05-GAL4) 10 min before and during testing impairs 6 h water memory expression in thirsty flies (dNPF-GAL4: p<0.01; R50H05-GAL4: p<0.03; n = 8; one-way ANOVA with Tukey’s test). e, Knockdown of NPFR in PAM-β′2a DANs (MB087C-splitGAL4) promotes water memory expression in hungry flies (p<0.006, n = 12; one-way ANOVA with Tukey’s test). f, Knockdown of 5HT1B in PPL1-γ2α′1 DANs (MB296B-splitGAL4) promotes water memory expression in hungry flies (p<0.03, n = 8; one-way ANOVA with Tukey’s test). Temperature regimens shown above d-f. Box-plots: center line indicates median; box limits, upper and lower quartiles; whiskers, max to min range; dots, individual data points. g, Incubating explant brains from fed flies (fed brains) with 100 nM LK decreases Ca2+ signal in PAM-β′2a DANs (MB087C > GCaMP6m; p=0.0226, n = 14; two-tailed paired t-test). 20 h starvation increased Ca2+ signal in PAM-β′2a DANs (p<0.001, n = 12-14; one-way ANOVA with Tukey’s test). Incubating explant brains from flies starved for 20 h (starved brains) with 100 nM LK decreased Ca2+ signal in PAM-β′2a DANs (p=0.0016, n = 12; two-tailed paired t-test), but the Ca2+ signal remained higher than the baseline Ca2+signal of fed brains (p<0.015, n = 12-14; one-way ANOVA with Tukey’s test). Incubating fed brains with 100 nM dNPF peptide increased Ca2+ signal in PAM-β′2a DANs (p=0.0011, n = 12; two-tailed paired t-test) whereas applying 100 nM dNPF and 100 nM LK together did not (p=0.4744, n = 12; two-tailed paired t-test). All data points normalized to the mean of Fed LK data set. Representative images of GCaMP6m signal shown under the plot. h, Incubating fed brains with 100 nM LK decreases Ca2+ signal in PPL1-γ2α′1 DANs (MB296B > GCaMP6m; p=0.0002, n = 16; two-tailed Wilcoxon matched-pairs signed rank test). 20 h starvation increased Ca2+ signal in PPL1-γ2α′1 DANs (p<0.0045, n = 13-16; one-way ANOVA with Tukey’s test). 100 nM LK decreased Ca2+ signal in PPL1-γ2α′1 DANs in starved brains (p=0.0004, n = 14; two-tailed paired t-test), to a level that is indistinguishable from the baseline Ca2+ signal in fed brains (p>0.84, n = 13-16; one-way ANOVA with Tukey’s test). Incubating fed brains with 100 nM 5-HT increased PPL1-γ2α′1 DAN Ca2+ signals (p=0.0452, n = 13-16; two-tailed paired t-test). Incubating fed brains with both 100 nM 5-HT and 100 nM LK decreased PPL1-γ2α′1 DAN Ca2+ signals (p=0.0251, n = 14; two-tailed paired t-test), although the effect size was less than when incubated with 100 nM LK alone (-23.56 ± 4.89% vs. -8.48 ± 3.31%; p=0.0167, n = 15 for LK+5HT and 16 for LK alone; two-tailed unpaired t-test with Welch’s correction). Representative images of GCaMP6m signal shown under the plot. See Supplementary Table 3 for statistics details.

