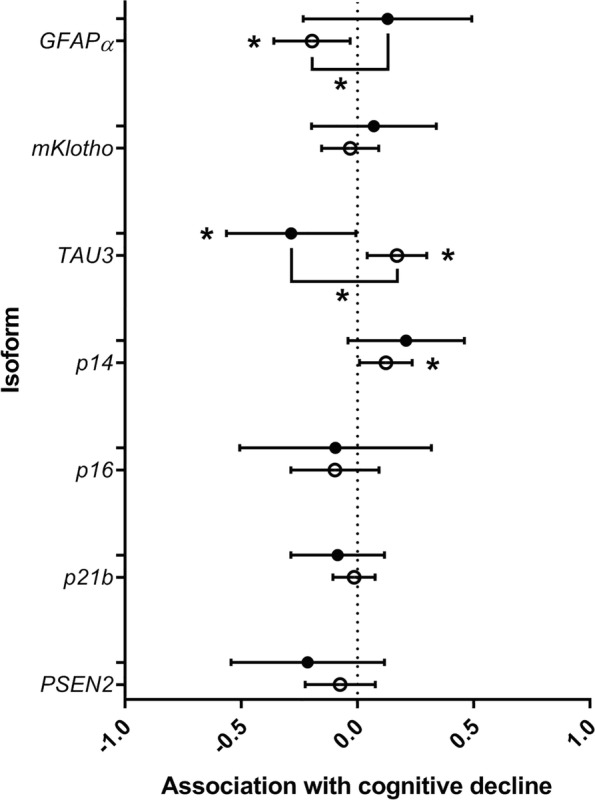
Fig. 2.

The association between isoform expression and cognitive decline in the InCHIANTI study of ageing. The graph indicates the associations between peripheral blood expression of alternatively expressed transcripts of genes with known links with neurodegenerative disease or cellular senescence and mild or severe cognitive decline is given in this figure. Mild decline is denoted by open circles; severe decline is denoted by closed circles. *p < 0.05. The null association point is given by the dotted line. Beta coefficients of association are given on the X axis and transcript identity is given on the Y axis. Data are from 197 participants classified as either mild cognitive decline (a reduction of 2–8 points in MMSE performance over a 3–7-year period) or severe decline (a reduction of 9–22 points in MMSE performance over the same period). Statistical differences in transcript expression between mild and severe decline are also given
