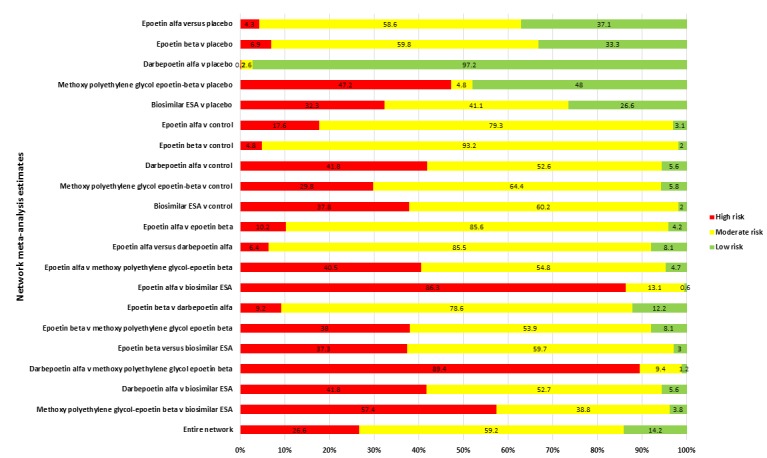
Figure 9.

Study limitations distribution for each network estimate for pairwise comparisons of erythropoiesis‐stimulating agents on the primary safety outcome (all‐cause mortality). Calculations are based on the contributions of direct evidence to the network estimates and the overall risks of bias from all bias domains (sequence generation, allocation concealment, blinding of participants and investigators, blinding of outcome assessment, attrition from follow‐up, selective outcome reporting and other sources of bias) within studies contributing to the direct evidence. The colours represent risk (green, low; yellow unclear; red, high). The direct comparisons are described in the vertical axis
