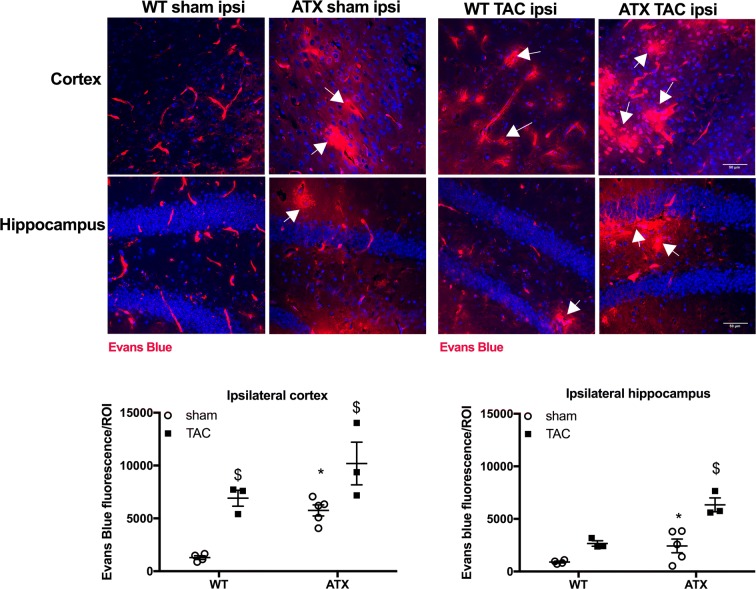
Fig. 8.
ATX mice exhibit an increase in BBB permeability. Representative images of Evans blue extravasation (% of Evans blue fluorescence/ROI) in the ipsilateral brain parenchyma of sham- and TAC-WT and -ATX mice are shown; scale bar = 50 μm, for all images. Data of sham-WT (n = 5) and sham-ATX (n = 5) mice and TAC-WT (n = 3) and TAC-ATX (n = 3) are summarized as mean ± SEM. *p < 0.05 vs. WT mice; $p < 0.05 vs. sham mice (within the corresponding genotype)

