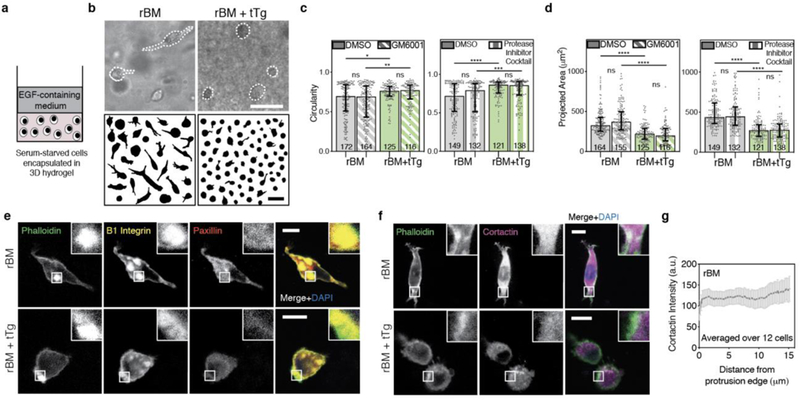
Fig. 3. Covalent cross-linking mediated by tissue transglutaminase physically restricts cancer cell spreading in reconstituted basement membrane matrices.

a, Schematic depicting the 3D encapsulation of MDA-MB-231 cancer cells in 8 mg/mL reconstituted basement membrane (rBM) hydrogels, without or with 500 μg/mL tissue Transglutaminase (tTg). b, After ~ 24 hours in 3D culture, cells were imaged using bright field microscopy and cell outlines were traced. Example MDA-MB-231 cells and cell outlines shown. Scale bars are 50 μm. c, MDA-MB-231 cell circularity and d, 2D-projected spread area in the different rBM matrices, in the presence of vehicle alone control, broad-spectrum matrix metalloprotease inhibitor (10 μM GM6001) or a protease inhibitor cocktail (20 μM Marimastat, 20 μM Pepstatin A, 20 μM E-64, 0.7 μM Aprotinin, and 2 μM Leupeptin). In c and d, bars indicate medians and error bars indicate interquartile ranges. Differences in morphological characteristics indicated are statistically significant (* P < 0.05, ** P < 0.01, **** P < 0.0001, Kruskal-Wallis Test). Data shown are from one representative biological replicate experiment, and additional biological replicates are shown in Supplementary Figure 2. e,f, Localization of indicated proteins on stained cryosections of MDA-MB-231 cells encapsulated for ~ 24 hours, imaged using confocal immunofluorescence. Main panel scale bar is 10 μm, and inset is 3x zoom. g, Cortactin intensity, measured from the tip of cellular protrusions toward the nucleus, averaged over protrusions from 12 cells in rBM alone matrices. Line plots mean intensity and error bars indicate 95% confidence interval.
