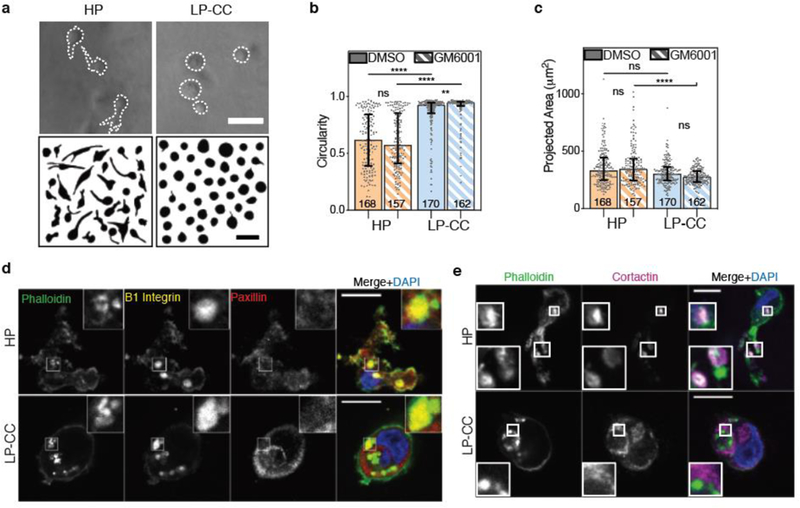
Figure 5. Low plasticity IPN matrix with covalent cross-links physically restricts cancer cell protrusivity, independent of proteases.

a, After ~ 24 hours in 3D culture, cells were imaged using bright field microscopy and cell outlines were traced. Example MDA-MB-231 cells and cell outlines shown. Scale bars are 50 μm. b, MDA-MB-231 cell circularity and c, 2D-projected spread area in the presence of broad-spectrum protease inhibitor (10 μM GM6001) or vehicle alone control. In b and c, bars indicate medians and error bars indicate interquartile ranges. Differences in morphological characteristics indicated are statistically significant (**** P < 0.0001, ** P < 0.01, Kruskal-Wallis Test). Data shown is from one representative biological replicate experiment, and an additional biological replicate is shown in Supplementary Figure 3. d and e, Localization of indicated proteins on stained cryosections of MDA-MB-231 cells encapsulated for ~ 24 hours, imaged using confocal immunofluorescence. Main panel scale bar is 10 μm and inset is 3x zoom.
