
FIG. 5.
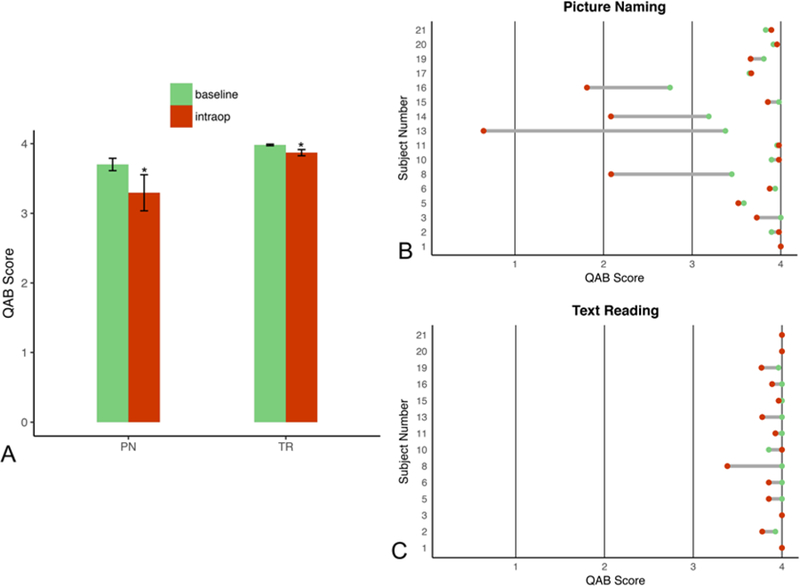
Language task performance across baseline preoperative and intraoperative testing environments. A: Bar plots showing a mean 10.8% decrease in performance on picture naming (PN) and a mean 2.8% decrease on text reading (TR) intraoperatively, with error bars indicating ± standard error. B: Dumbbell plot indicating individual performances on picture naming; the bottom quintile of performers on preoperative examination suffered from the largest declines in intraoperative performance. C: Dumbbell plot of text reading with a relatively small variation in performance. *p < 0.05.