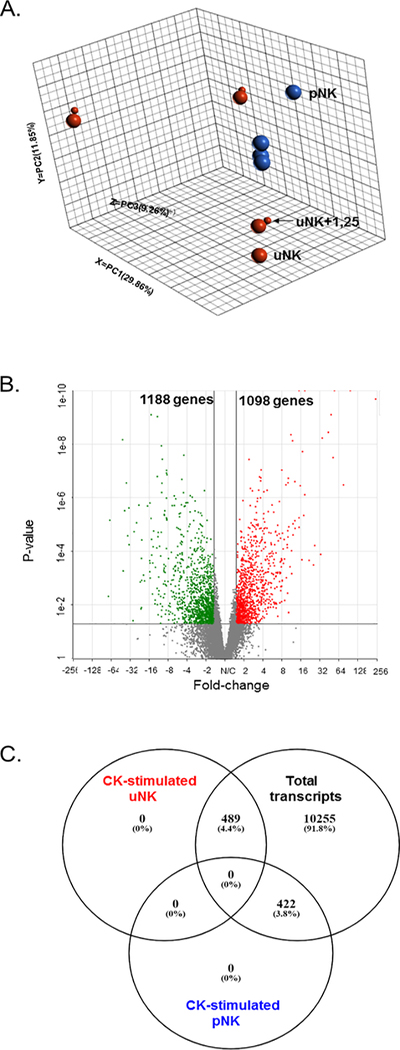
Figure 1. Transcriptomic analysis of cytokine (CK) stimulated pNK and uNK cells.
A. Principal component analysis (PCA) analysis of CK-stimulated uNK and pNKs in the presence and absence of 1,25(OH)2D3. 3-dimensional dot-plot summarising the main sources of variance across the whole RNA-seq data set by principal components; PC1 29.9%, PC2 11.9%, PC3 9.3%. This includes pNK (red), uNK (blue) in the presence (small dot) and absence (large dot) of 1,25(OH)2D3 co-treatment. B. Volcano plot summary of differentially expressed genes in CK-stimulated uNK relative to CK-stimulated pNK. Significantly up-regulated genes in CK-stimulated uNKs are in red (n=1098), down-regulated genes in green (n=1188), with those not significantly different in grey (n= 11163). A cut-off of p≤0.05 and fold change ≤−1.5 or ≥+1.5 was used to determine significance. C. Venn diagram summarising the distribution of differentially-expressed genes in CK-stimulated uNK relative to CK-stimulated pNK compared to total transcripts in CK-stimulated uNK and CK pNK following adjustment for false discover rate (FDR): p value ≤ 0.05; log2 fold-change ≤1.5 or ≥1.5, FDR step-up ≤ 0.05.

