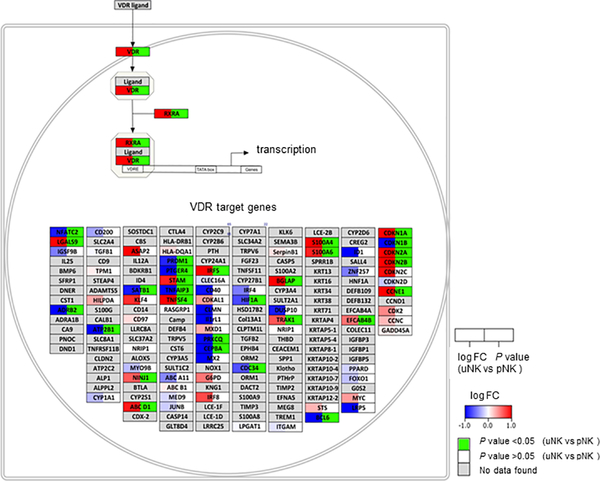
Figure 2. Pathway analysis of vitamin D receptor (VDR) signalling-related genes in CK-stimulated uNK versus CK-stimulated pNK.
Visualisation of genes with enhanced (red) or suppressed (blue) expression in CK-stimulated uNK versus CK-stimulated pNK. Individual genes are shown in boxes and box colour split into two parts, (1) the log2 fold-change in the left part of the box (blue down-regulated, white not changed, red up-regulated) and (2) p-value for statistical significance is shown in the right part of the box (green when significant). Pathway elements not assessed in the dataset are shown in grey.

