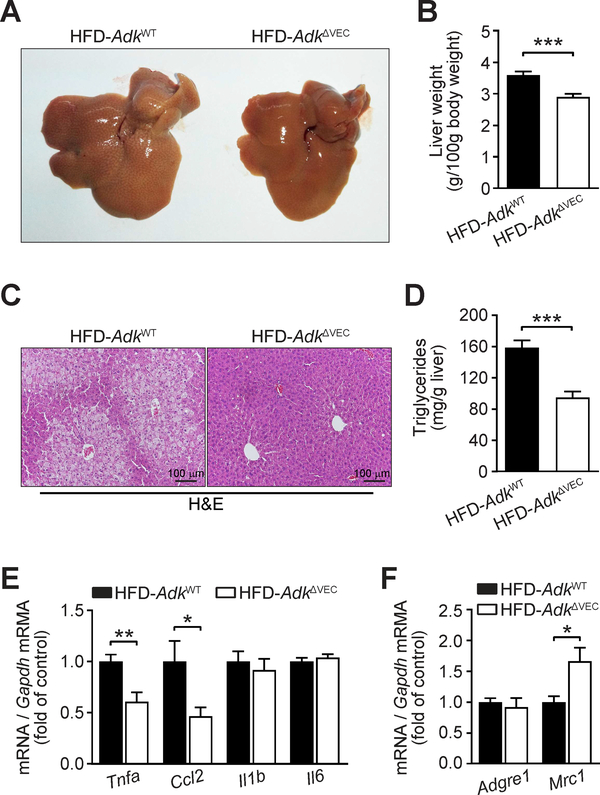
Figure 4. Decreased HFD-induced hepatic steatosis in EC Adk-deficient mice.
A. Representative gross morphology of liver from AdkWT and AdkΔVEC mice after 12 weeks of HFD (n = 4 images per group). B. Liver weight of AdkWT and AdkΔVEC mice after 12 weeks of HFD (n = 10 mice per group). C. Representative hematoxylin and eosin (H&E) staining of liver sections from AdkWT and AdkΔVEC mice after 12 weeks of HFD (n = 4 images per mouse; n = 4 mice per group). D. Triglyceride content in liver of AdkWT and AdkΔVEC mice after 12 weeks of HFD (n = 6 mice per group). E. qPCR analysis of expression of hepatic inflammatory cytokines in AdkWT and AdkΔVEC mice after 12 weeks of HFD (n = 8 mice per group). F. qPCR analysis of expression of hepatic M2 macrophage marker in AdkWT and AdkΔVEC mice after 12 weeks of HFD (n = 8 mice per group). All data are represented as mean ± SEM, *P < 0.05, **P < 0.01 and ***P < 0.001 for AdkΔVEC vs. AdkWT (unpaired two-tailed Student’s t test).

