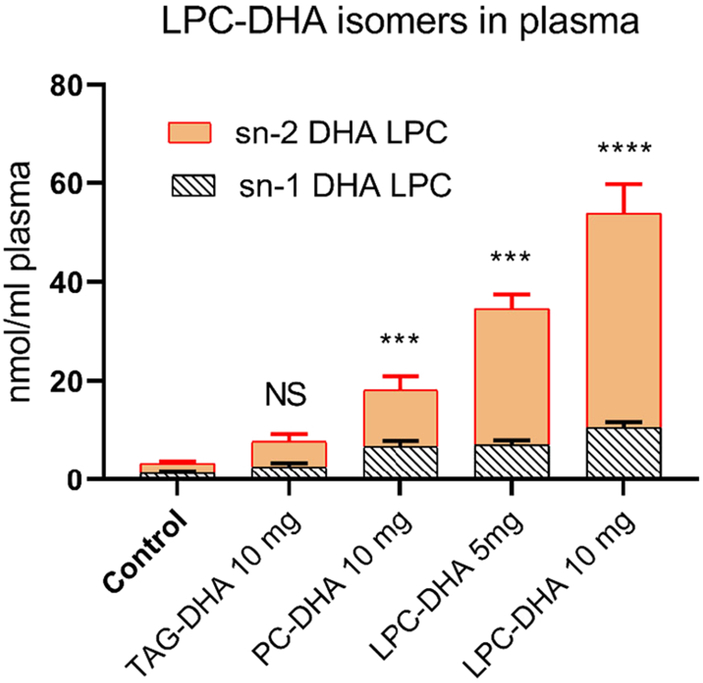
Fig. 3: Isomers of LPC-DHA in plasma.
The positional isomers of LPC-DHA were analyzed by LC/MS/MS, as described previously [18]. The results shown are mean ± SD of 5 animals per group. Statistical significance shown is between control (untreated) group and DHA-treated groups for the total LPC-DHA. Similar significance values were obtained when the two isomers were analyzed separately (not shown). *** p< 0.001; **** p< 0.0001.

