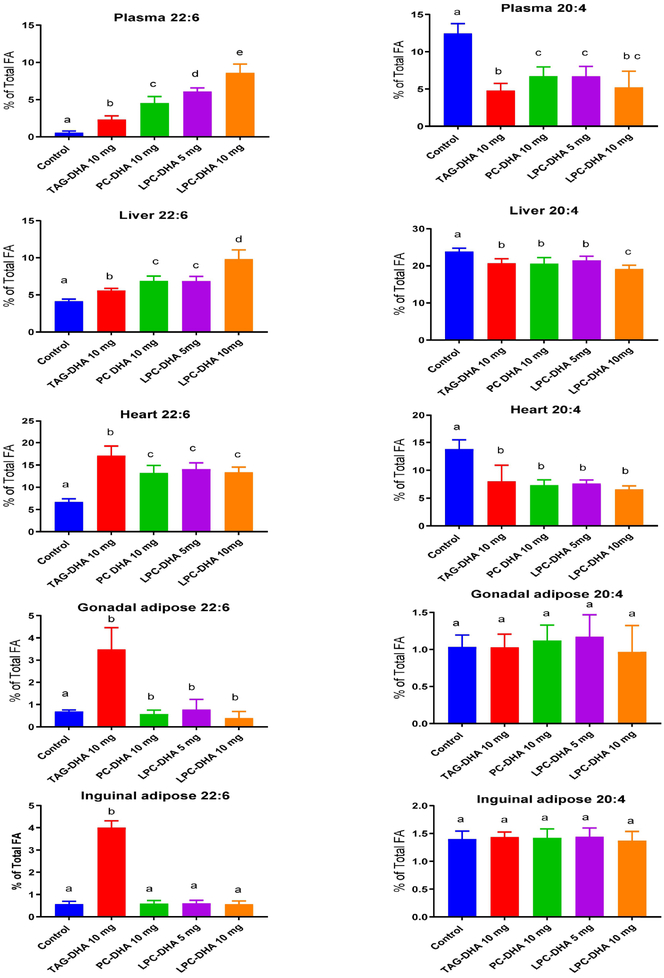
Fig. 4: Effect of dietary treatments on DHA and ARA levels in systemic tissues.
The total fatty acid composition of plasma and various tissues was analyzed by GC/MS as described in section 2.5. Only the values for DHA and ARA are shown here. The total fatty acid composition is shown in supplementary Tables-1-5. The differences between treatment groups were analyzed by one-way ANOVA with correction by Tukey multiple comparison test (Prism, Graphpad software). Bars with common letter superscripts are not significantly different from each other (n=10 for all groups) The magnitude of differences between individual treatments is shown in Supplemental Figure S2.

