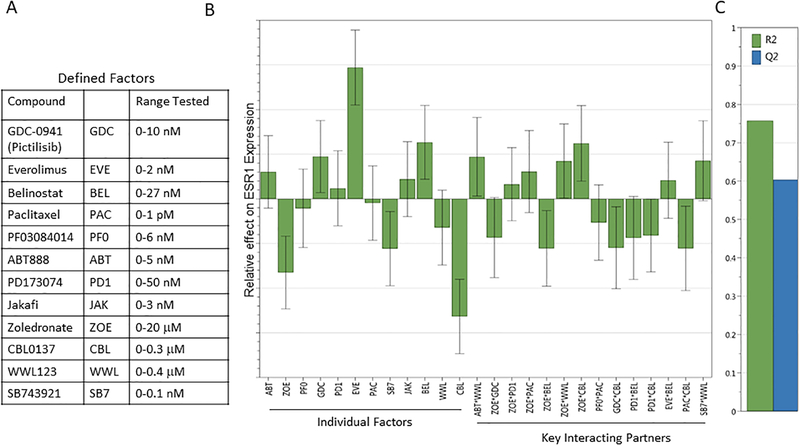
Figure 2. DoE Factors and ESR1 response global model fitting.
Using the defined factors at the indicated concentration ranges (A) and ESR1 as the response target, global model fitting was performed to optimize the R2/Q2 ratio. (B) The graph depicts individual factor contribution and key interacting partners and their effects on ESR1 expression allowing for optimal predictive model fitting.

