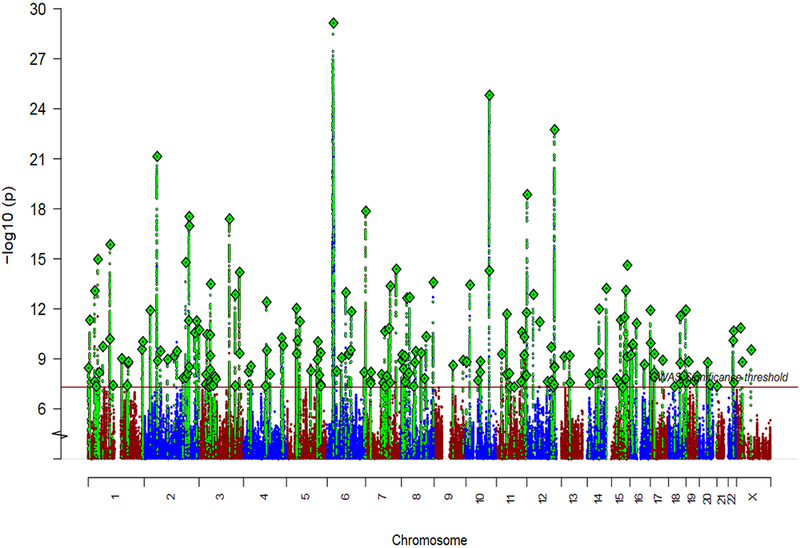
Figure 2 ∣. Schizophrenia associations in EUR and EAS samples.

Manhattan plot for the schizophrenia genetic associations from the EAS (stages 1 and 2) + EUR meta-analysis (n = 56,418 cases; 78,818 controls).

Manhattan plot for the schizophrenia genetic associations from the EAS (stages 1 and 2) + EUR meta-analysis (n = 56,418 cases; 78,818 controls).