
Figure 4 ∣. Genetic risk prediction accuracy in EAS from EAS or EUR training data.
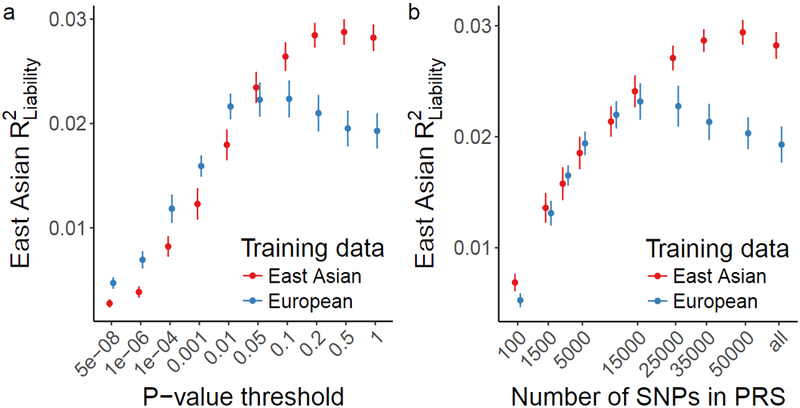
Polygenic risk scores were computed with GWAS summary statistics from EAS and EUR populations as training sets. EAS risk alleles and weights were computed with a leave-one-out meta-analysis approach across the 13 stage 1 samples. Error bars indicate the 95% confidence interval. LD panel for clumping is from EUR and EAS 1000 Genomes Phase 3 samples. a, Case/control variance explained in EAS samples by variants from EAS and EUR training data with a P-value more significant than the threshold. b, Case/control variance explained by the n most significant independent variants. a-b, For EAS stage 1: 13,305 cases and 16,244 controls; For EUR 33,640 cases and 43,456 controls.