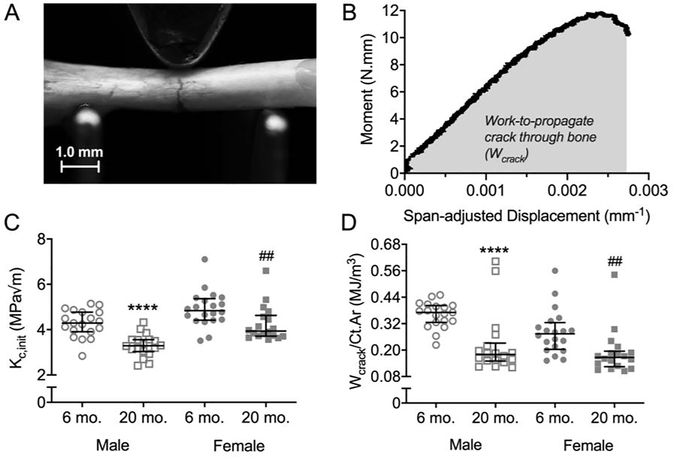
Figure 4:
Crack resistance of the femoral cortex. In fracture toughness tests, a crack is propagated by loading a femur mid-shaft with a micro-notch on the tension side of bending (A). The stress intensity to initiate the crack was estimated from the yield moment, and the work during crack growth (Wcrack) per bone cross-sectional area (Ct.Ar) was estimated from the area under the moment vs. span-adjusted displacement curve (B). Kc,init (C) and Wcrack/Ct.Ar (D) were lower for old than young adult mice in both sexes. ***p<0.001 and ****p<0.0001 within male. ##p<0.01 and ####p<0.0001 within female.

