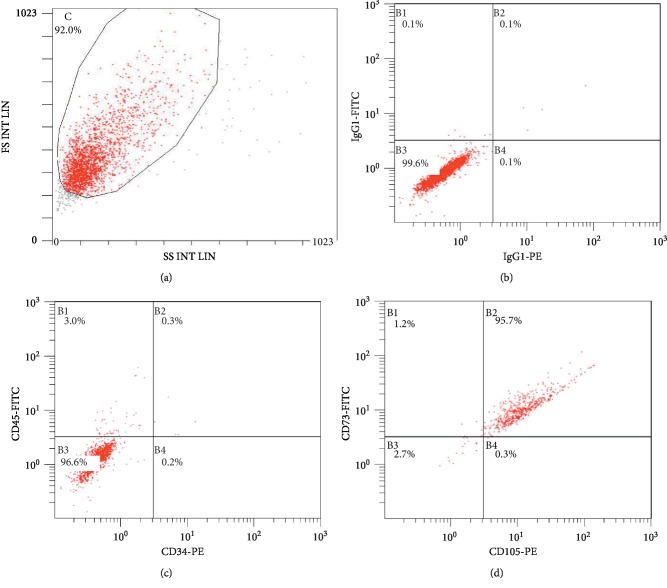
Figure 1.
Characterization of hUC-MSCs by flow cytometry. (a) Representative dot plots showing the FSC to SSC. (b) IgG1-PE and IgG1-FITC were used as controls. (c) Cells expressing both CD34 and CD45 represented 0.7% of the population. (d) Cells expressing both CD105 and CD73 accounted for 96.4% of the population.

