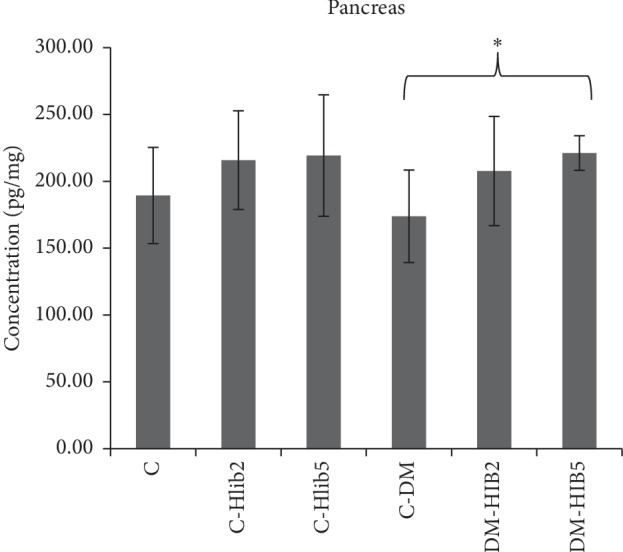
Figure 2.

Average GLP-1 levels in the pancreas (pg/mL). C: normal control; C-Hib2: Hib-control200; C-Hib5: Hib500-control; C-DM: DM control; DM-Hib2: DM-Hib200; DM-Hib5: DM-Hib500. There was a significant difference between the C-DM group and DM-Hib2 group (∗p < 0.05).
