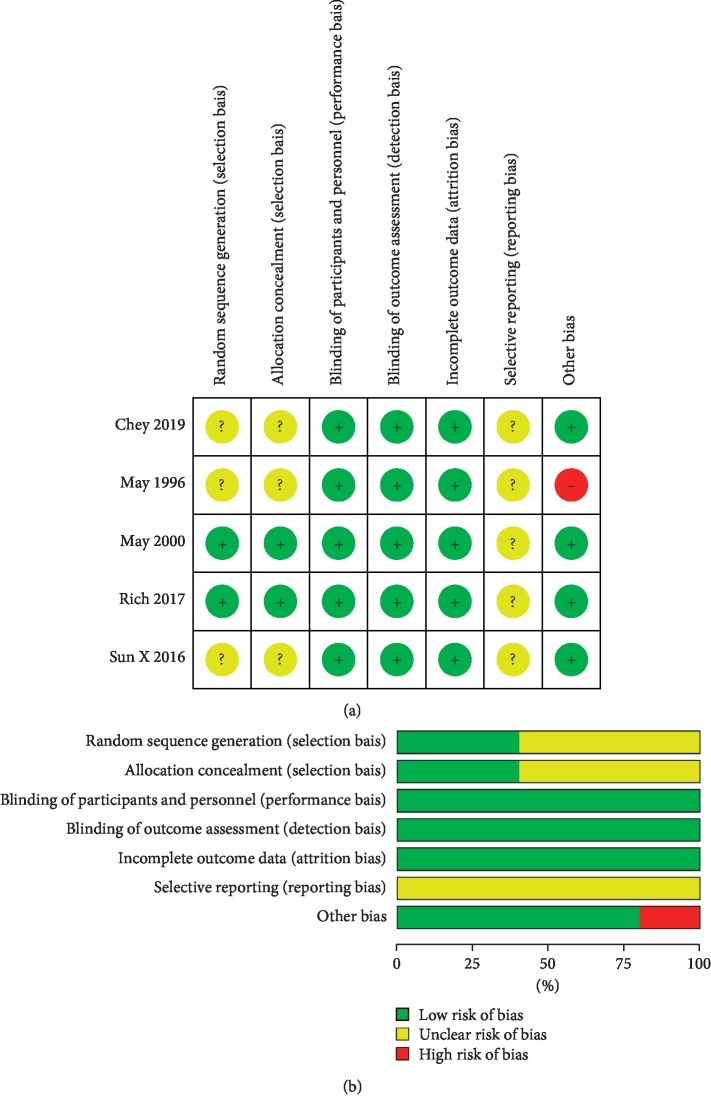
Figure 2.
Risk of bias assessment using the Cochrane Collaboration's tool. (a) Risk of bias summary: “+” denotes low risk of bias, “?” denotes unclear risk of bias, and “−” denotes high risk of bias. (b) Risk of bias graph: green, low risk of bias; yellow, unclear risk of bias; red, high risk of bias.

