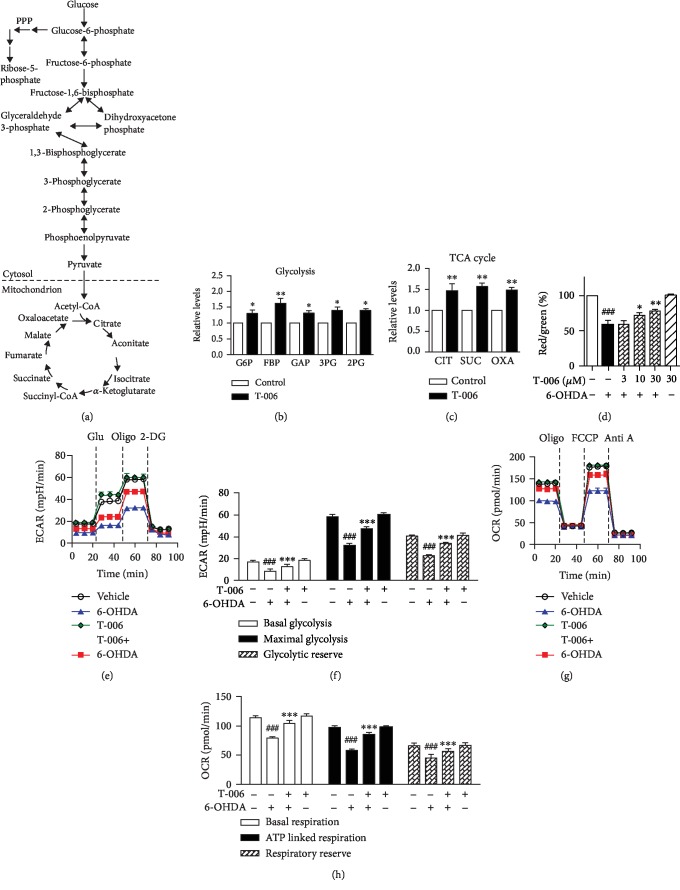
Figure 2.
T-006 increases energy metabolism and mitochondrial functions in PC12 cells. PC12 cells were pretreated with T-006 (30 μM) or 0.1% DMSO (vehicle control) for 12 h; intracellular glycolysis and TCA cycle metabolites were measured by LC-MS. (a) A simplified metabolic flow diagram of glycolysis and the TCA cycle (red, upregulated). (b) Relative levels of enhanced glycolytic intermediates. (c) Relative levels of enhanced TCA cycle intermediates. G6P: glucose 6-phosphate; FBP: fructose 1,6-phosphate; GAP: glyceraldehyde 3-phosphate; 3PG: 3-phosphoglycerate; 2PG: 2-phosphoglycerate; CIT: citrate; SUC: succinate; OXA: oxaloacetate. PC12 cells were pretreated with T-006 (30 μM) or 0.1% DMSO for 12 h and then challenged with or without 150 μM 6-OHDA for another 12 h. (d) PC12 cells were pretreated with T-006 (3, 10, and 30 μM) or 0.1% DMSO for 12 h and then challenged with or without 150 μM 6-OHDA for an additional 6 h. Δψm was determined by flow cytometry. (e) The extracellular acidification rate (ECAR) was measured as an indicator of glycolytic activity using an XF24 Extracellular Flux Analyzer (normalized to protein content). The sequential injection of glucose, oligomycin, and 2-DG is indicated by vertical lines. (f) Quantitative data of basal glycolysis, maximal glycolysis, and glycolytic reserve (data from (e)). (g) The oxygen consumption rate (OCR) was measured as the mitochondrial OXPHOS activity. The sequential injection of mitochondrial inhibitors is indicated by vertical lines. (h) Quantitative data of basal respiration, ATP-linked respiration, and respiratory reserve (data from (g)). Data from three independent experiments are represented as the mean ± SD. ###P < 0.001 as compared to the control group; ∗P < 0.05, ∗∗P < 0.01, and ∗∗∗P < 0.001, as compared to the 6-OHDA-treated group.

