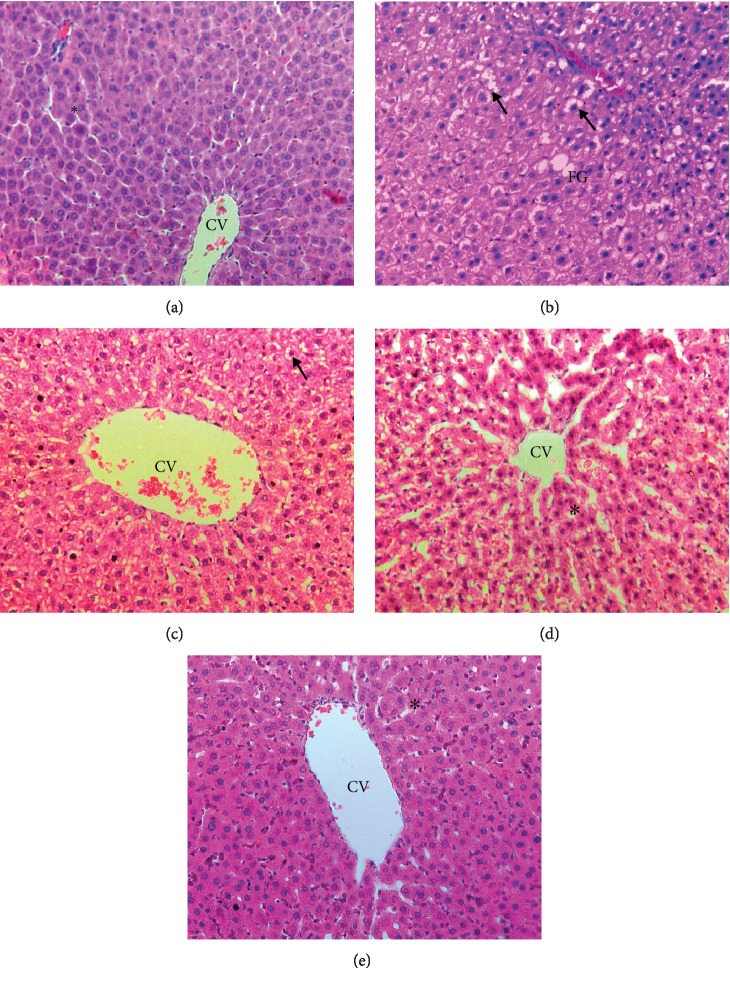
Figure 1.
(a) Photomicrograph showing H&E-stained liver tissue of the Sham group. Normal sheets of hepatocytes (∗) were seen surrounding the central vein (CV). H&E staining 200x. (b) Photomicrograph showing H&E-stained liver tissue of the untreated OVX group. Note the presence of fat globules (FG) and enlarged hepatocytes with hypercellularity (arrow). H&E staining 200x. (c) Photomicrograph showing H&E-stained liver tissue of the ovariectomized group fed with TPO diet and treated with statin (OVX+ST) which also showed the presence of enlarged hepatocytes (arrow). H&E staining 200x. (d) Photomicrograph showing H&E-stained liver tissue of the ovariectomized group fed with TPO diet and treated with MC leaf 500 mg/kg (OVX+MCLD). Normal sheets of hepatocytes (∗) were seen surrounding the central vein (CV). H&E staining 200x. (e) Photomicrograph showing H&E-stained liver tissue of the ovariectomized group fed with TPO diet and treated with MC leaf 1000 mg/kg (OVX+MCHD). Normal sheets of hepatocytes (∗) were seen surrounding the central vein (CV). H&E staining 200x.

