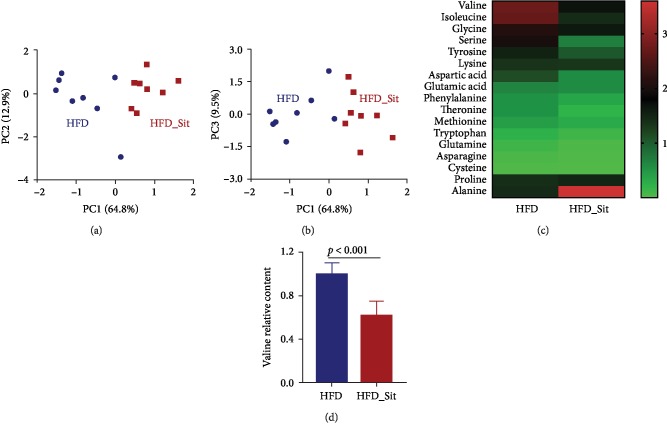
Figure 1.
Sitagliptin treatment reduced the valine levels in HFD-fed mice. (a, b) Cluster analysis of the HFD-fed and HFD_Sit mice based on the amino acid concentrations using PCA. The principal components (PC1, PC2, and PC3) from the PCA are plotted for each sample. The percentage of variation covered in the plotted principal components is marked on the axes. Each group is labeled by a different symbol, and each spot represents one sample. (c) Heat map analysis of amino acid levels in the HFD and HFD_Sit groups. Each column in the heat map represents the group, and each row represents one amino acid. The color bar showing green to red indicates the relative level of each amino acid. (d) The relative level of valine in the HFD and HFD_Sit groups. (a–d) n = 8; data in (d) are presented as the means ± SD, t-test.

