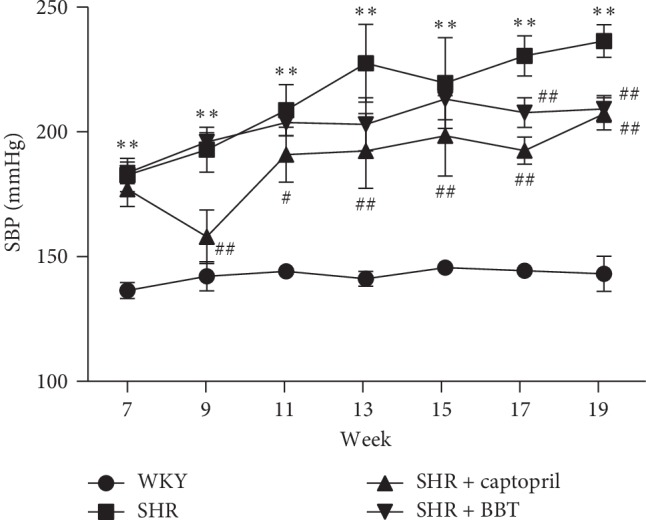
Figure 2.

Time course of systolic blood pressure of the four groups of rats measured by tail-cuff method. Data are expressed as the mean ± SEM (n = 6 in each group). ∗∗P < 0.01 vs. WKY; #P < 0.05 and ##P < 0.01 vs. SHR.

Time course of systolic blood pressure of the four groups of rats measured by tail-cuff method. Data are expressed as the mean ± SEM (n = 6 in each group). ∗∗P < 0.01 vs. WKY; #P < 0.05 and ##P < 0.01 vs. SHR.