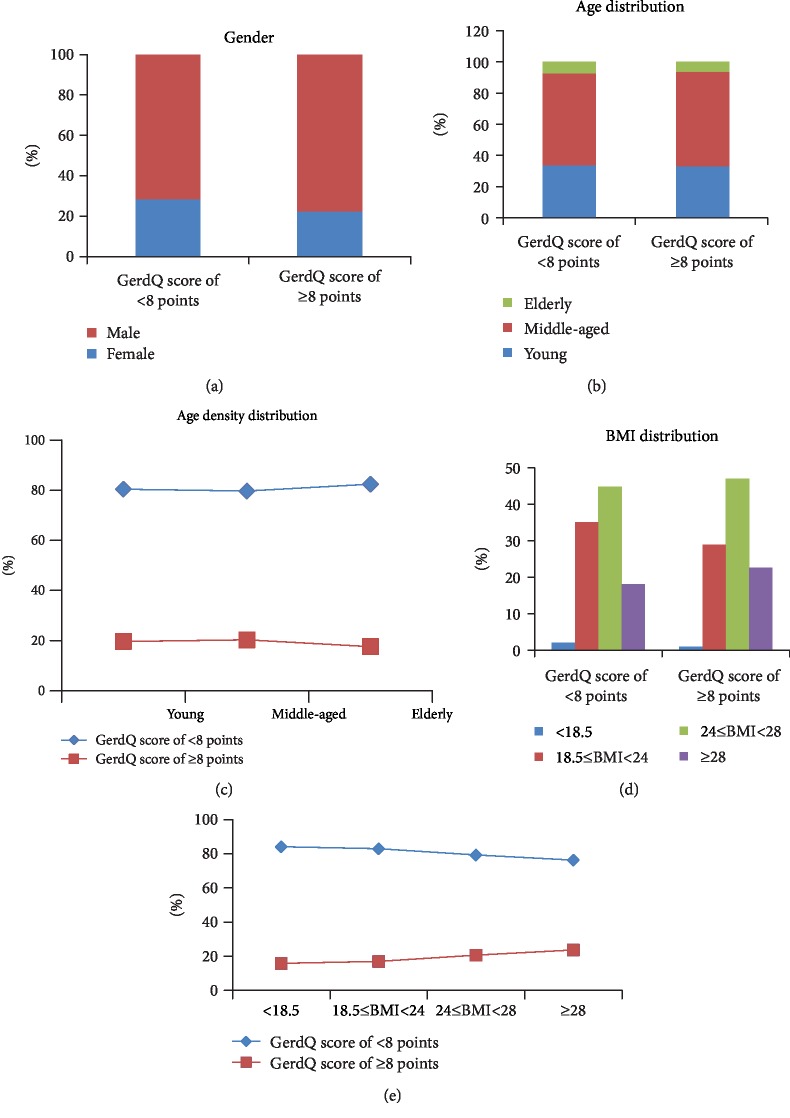
Figure 1.
Distributions of clinical traits between the groups with GerdQ score of ≥8 points and GerdQ score of <8 points. (a) Sex distribution in these two groups. Y-axis represents sex composition. Blue color represents female individuals, and red color represents male individuals. (b) Age distribution of these two groups. (c) Different age groups' change curve of GerdQ score of ≥8 points and GerdQ score of <8 points. (d) Frequency of BMI among these two population groups. (e) Different BMI groups' change curve of GerdQ score of ≥8 points and GerdQ score of <8 points.

