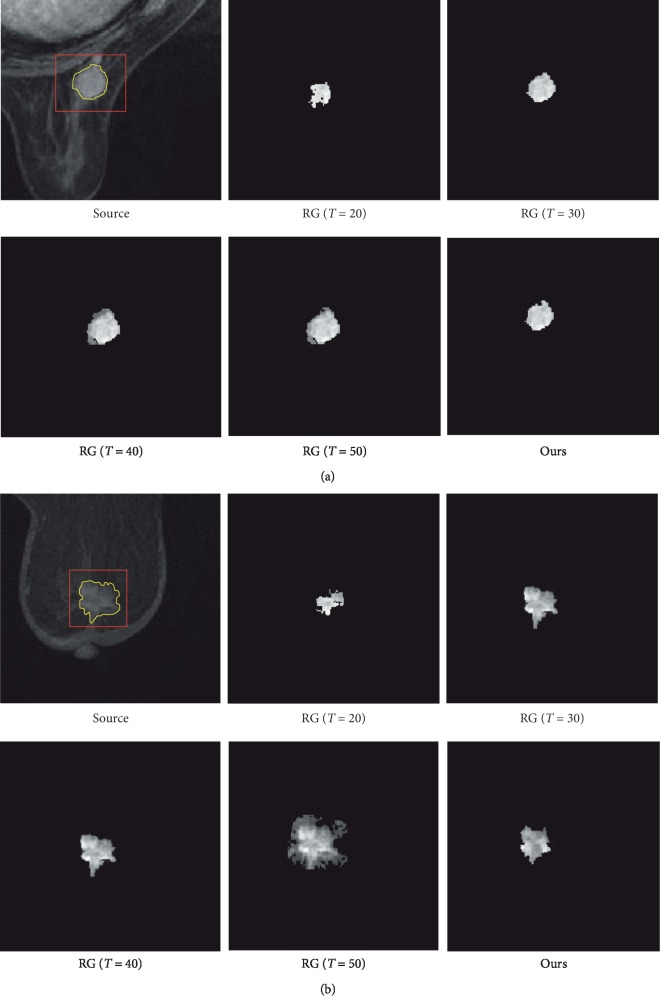
Figure 2.
Breast cancer lesion segmentation. Regular lesion with smooth edge (a) and irregular lesion with more burrs (b). The lesion marked by rectangle and the actual border of lesion is shown as yellow curves; RG (T = 20, 30, 40, 50) shows the segmentation results by regular region growth algorithm. Ours is the result by the improved region growth algorithm in this paper.

