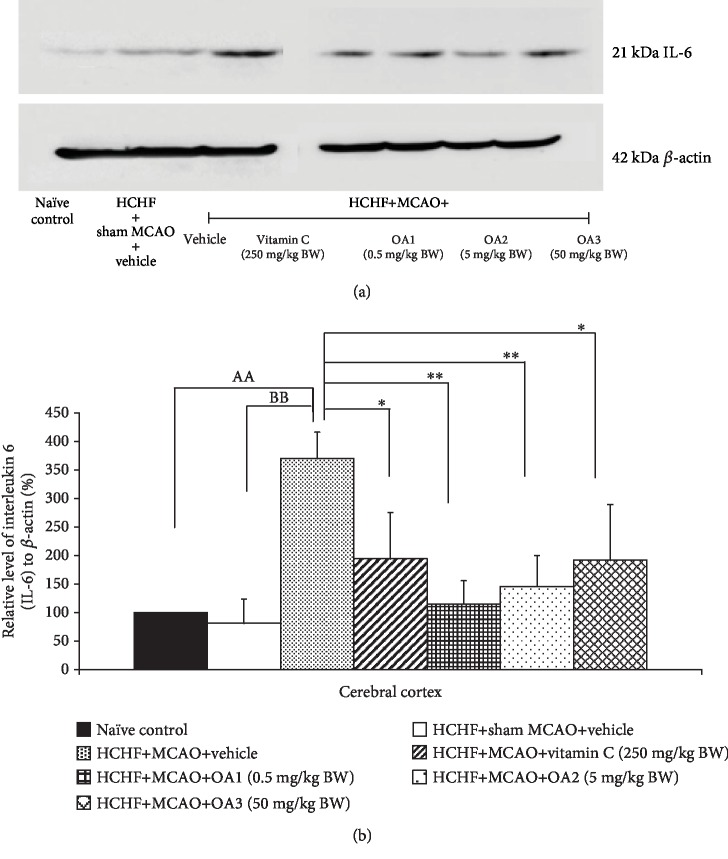
Figure 6.
Effect of various doses of OA extract on the expression of IL-6 in the cerebral cortex. (a) Representative western blot showing the levels of IL-6. (b) Relative density of IL-6. Data are presented as mean ± SEM (n = 6/group). AAp value < 0.01; compared to naïve intact rats, BBp value < 0.01; compared to sham operation which received HCHF diet and vehicle and ∗,∗∗p value < 0.05, 0.01, respectively; compared to MCAO rats which received HCHF and vehicle. HCHF: high-carbohydrate high-fat diet; MCAO: right middle cerebral artery occlusion; OA1, OA2, and OA3: the combined extract of O. sativa and A. graveolens at doses of 0.5, 5, and 50 mg/kg BW, respectively.

