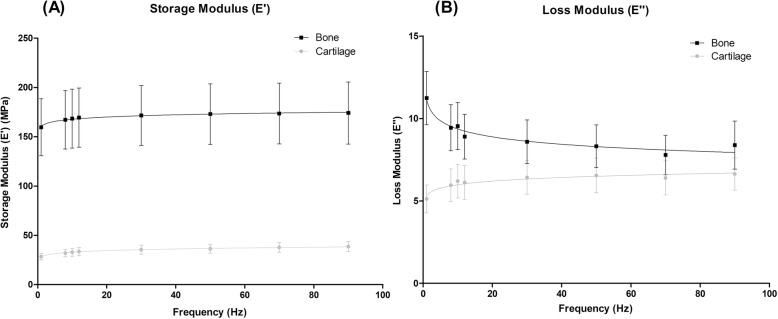
Fig. 3.
Storage (a) and loss (b) moduli for isolated cartilage and bone specimens plotted against frequency from 1 to 90 Hz (mean ± 95% confidence intervals, (N = 5) with natural logarithmic regression trendlines). In total, 19 cartilage and 18 bone specimens from five femoral heads were tested. Results are displayed on a linear scale

