. 2019 Nov 3;16(6):543–552. doi: 10.21873/cgp.20156

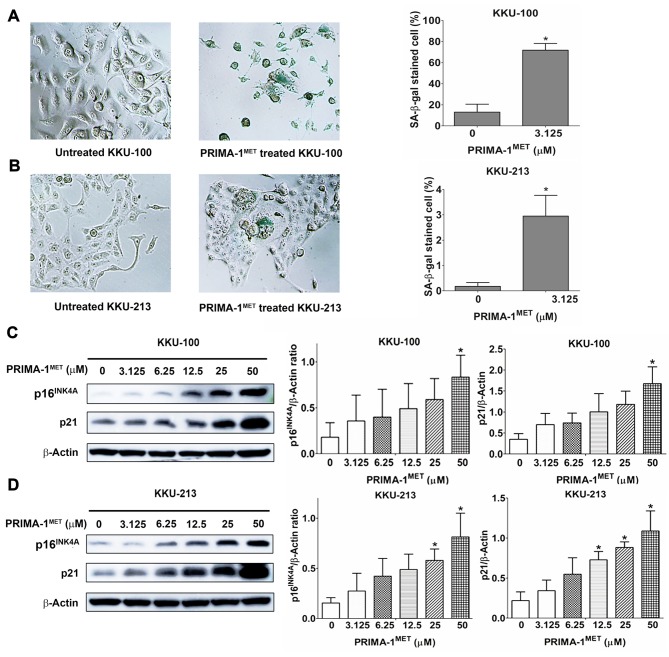
Figure 3. The induction of cellular senescence by PRIMA-1MET in KKU-100 and KKU-213 cells. A and B: The left panel shows senescence associated (SA)-β-galactosidase staining in KKU-100 (A) and KKU-213 (B) for 9 days after the initiation of treatment with 3.125 μM PRIMA-1MET (original magnification 100×). The right panel shows quantification of the mean±SD proportion of SA-β-gal-positive CCA cells taken from three independent experiments. C and D: The left panel shows western blot analysis of p16INK4A and p21 protein expression in KKU-100 (C) and KKU-213 (D) cells after PRIMA-1MET treatment. The right panel shows quantification of the mean±SD protein band intensity taken from three independent experiments. These were normalized to the intensity of β-actin. *Significantly different from untreated cells at p<0.05.

Figure 3