. 2019 Nov 3;16(6):505–518. doi: 10.21873/cgp.20153

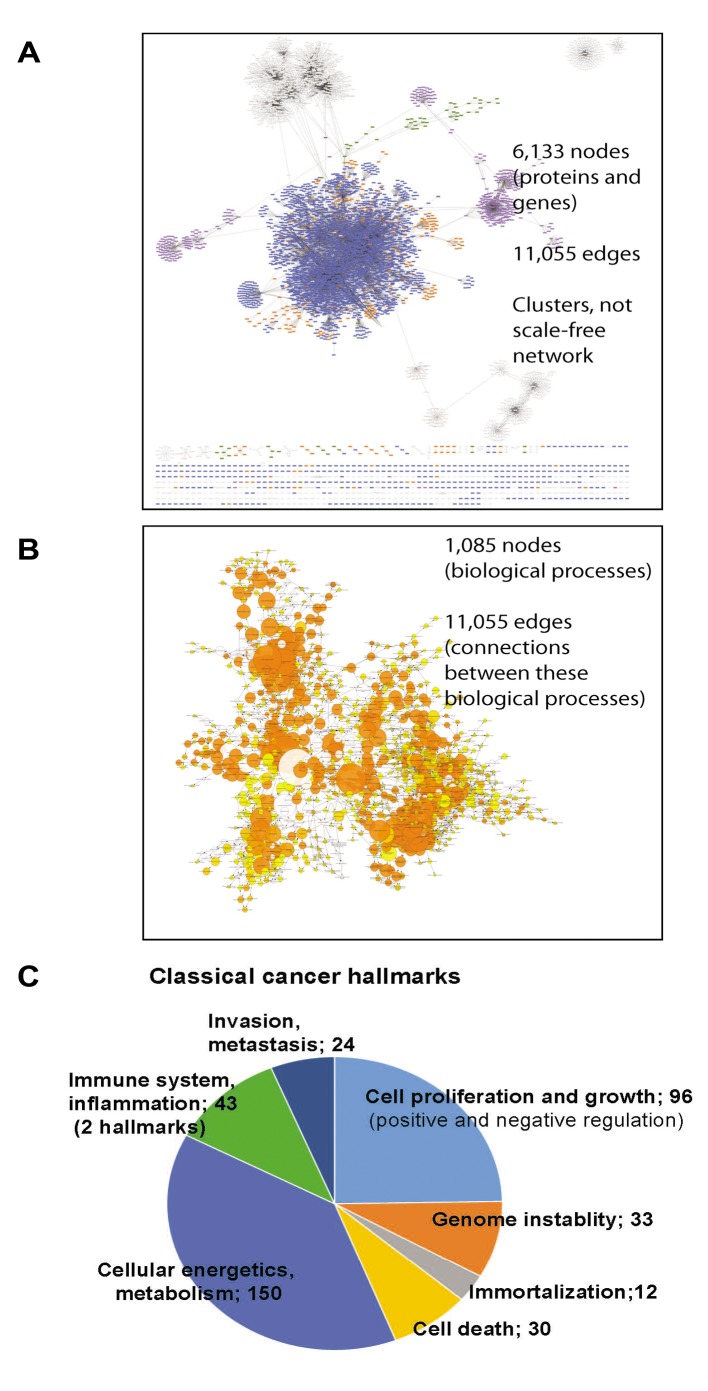
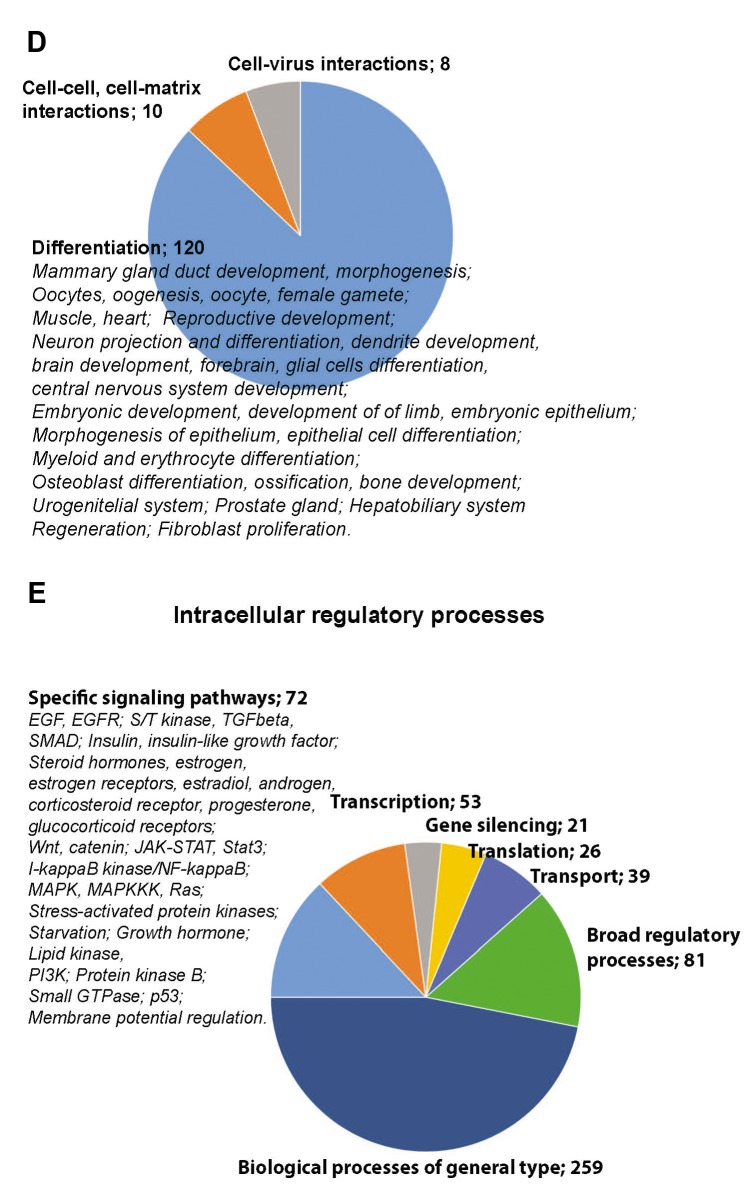
Figure 3. Systemic analysis of the proteome profiling. A) Network of species affected by the identified invasiveness-relevant proteins shows presence of clusters and a large number of involved nodes, e.g. 6,113 nodes. B) Biological processes represented in the invasiveness network are shown. Relations between these processes are presented as a network. Size of the nodes correlates with the number of species engaged in that biological process. Original data of the networks shown in (A) and (B) are in files deposited at BioModels at ebi.ac.uk, identifier MODEL1906040001, with statistic values for each process/node. Distribution of biological processes of relevance to currently accepted cancer hallmarks (C), biological processes not yet included in the cancer hallmarks (D), and relevant to intracellular regulatory mechanisms (E) are shown.

Figure 3

Figure 3