. 2019 Nov 3;16(6):505–518. doi: 10.21873/cgp.20153

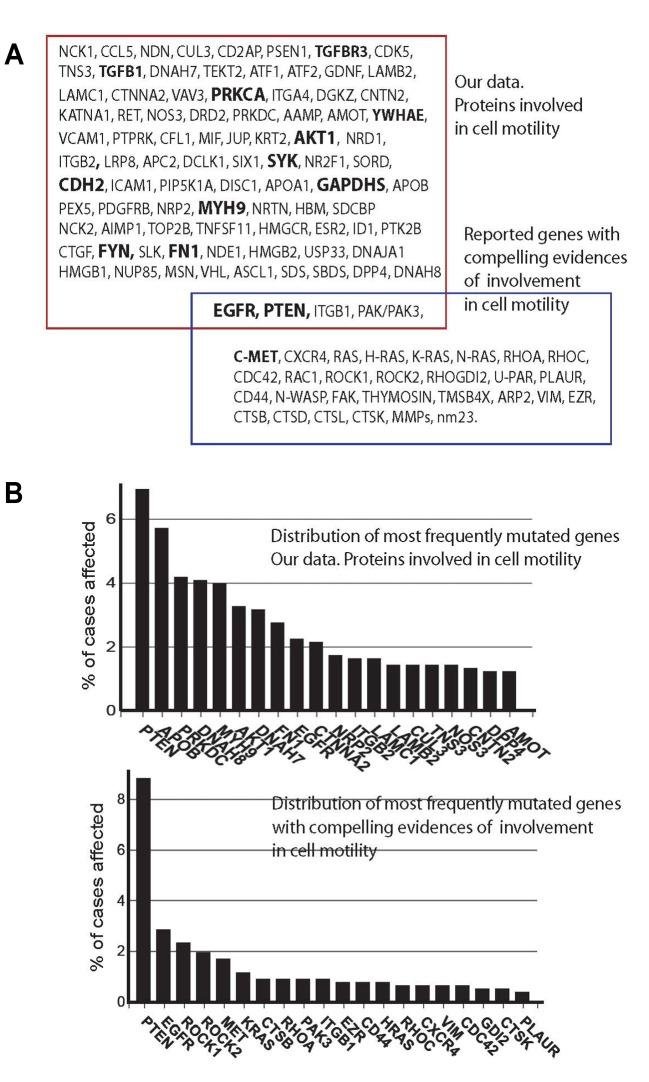
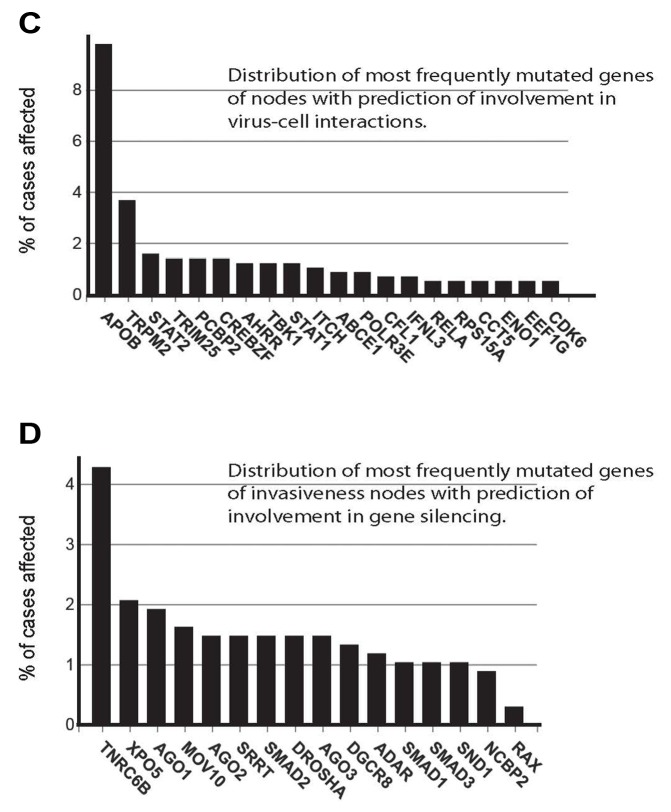
Figure 4. Nodes engaged in regulation of cells motility and correlations with clinical outputs. A) Intersection of the nodes involved in cell motility and identified in this work with the set of genes with compelling evidences of involvement in cell motility is shown (40). GO terms in bold annotate nodes which showed correlations with clinical data on survival of breast cancer patients. Survival data were retrieved from the TCPA portal (https://www.tcpaportal.org/), and contain data of 436 cases. B) Frequencies of mutations of genes of the motility nodes (upper graph) and previously reported motility genes (lower graph) (40) are shown. Top 20 mutated nodes are annotated. C) Frequencies of mutations of genes of the cell-virus interaction nodes. Top 20 nodes are annotated. D) Frequencies of mutations of genes of the gene silencing nodes. Top 16 nodes are annotated. Data for B, C and D were retrieved from GDC database (https://portal.gdc.cancer.gov/). The top nodes with highest mutation frequencies are shown.

Figure 4

Figure 4