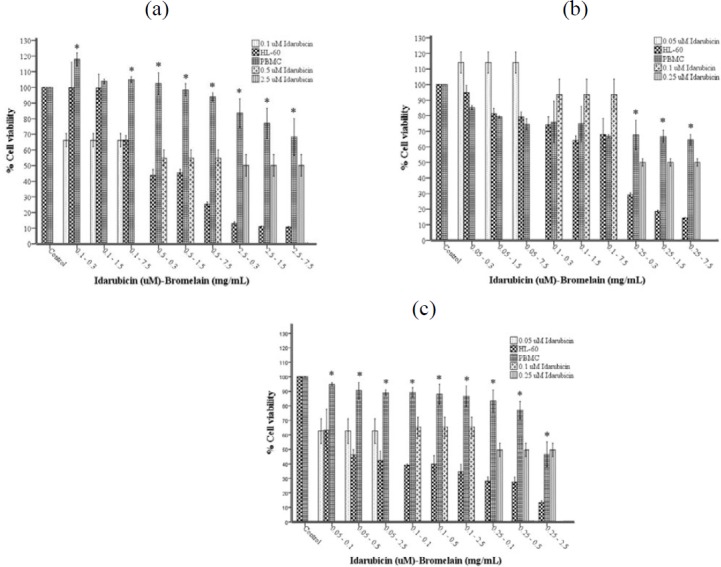
Figure 3.

(a-c). Growth inhibition of PBMC and HL-60 cell lines treated with IDA-BRO combinations by The CellTiter-Glo Luminescent Cell Viability Assay after 24 (a), 48 (b), and 72 (c) hr incubation. Each point represents a mean±SD of three experiments with three replicates per combination. Values marked with * indicate significant differences between HL-60 and PBMC for the same combination
