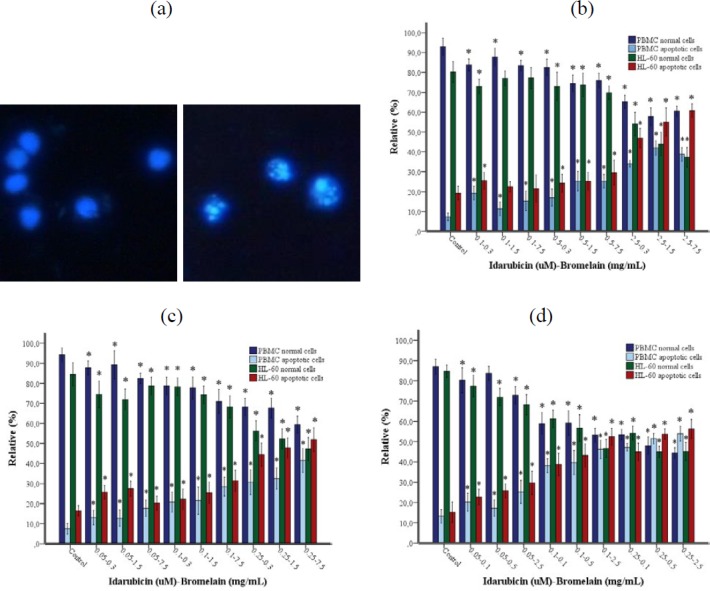
Figure 7.

(a-d). Apoptotic and normal cell percentages determined by DAPI fluorescence staining method. (a) Normal cells and apoptotic cells. Magnification was 40X. (b) 24, (c) 48, (d) 72 hr incubation. Each column represents a mean±SD of three experiments with three replicates per combination. *P<0.05 vs Control group (HL-60 or PBMC)
