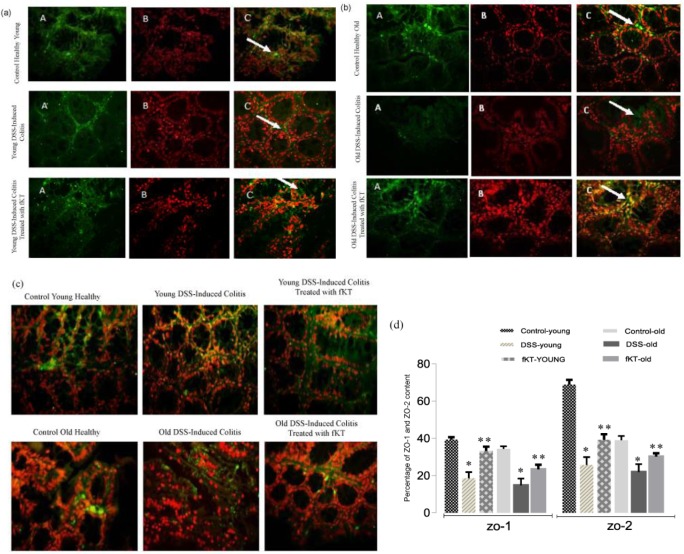
Figure 8.
(a, b) Immune florescent-staining of ZO-1 protein expression (A: Primary antibody to ZO1, B: nuclei stain by PI, C: Merge A&B, Magnification: ×400) and (c) ZO-2 protein expression in the colons of mice. A positive reaction was observed as green staining. (d) The images were analyzed using image j scan software (imagej.nih.gov/ij, in 4 nonconsecutive tissue sections). Total expression of ZO-1 and ZO-2 was evaluated in the same fields. The ratio of the total expression of ZO-1 and ZO-2 to total tissue was evaluated and reported to percent. Data are presented as the mean of 5 randomly selected fields of microscopic view. (* P<0.07 vs control, ** P< 0.05 vs DSS-mice)

