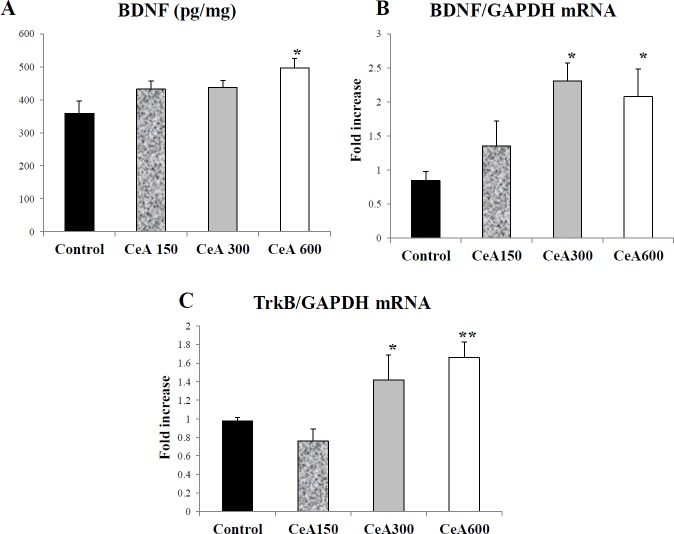
Figure 2.
The concentration of BDNF (pg/mg), the expression of BDNF mRNA, and the expression of TrkB mRNA in hippocampal tissue after Centella asiatica (CeA) treatment of chronic electrical stress in all four groups (P<0.05, each group n=5). (A) The hippocampal BDNF protein level was assessed by ELISA (B-C) The mRNA expression of hippocampal TrkB and BDNF (each group n=5). Data were expressed as Mean±SD. *= P<0.05 vs Control, **= P<0.05 vs CeA150 group. CeA150, CeA300 and CeA600 represented groups with CeA 150, 300 and 600 mg/Kg Body weight treatment

