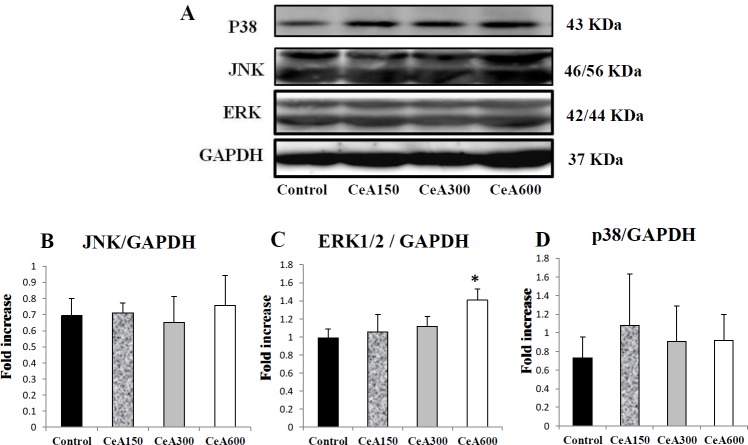
Figure 3.
The expression of MAPK in the hippocampus tissues after administration of ethanol extract of Centella asiatica (CeA) after chronic electrical stress. (A) The representative picture of p38, JNK, ERK, and GAPDH analyzed with western blotting (B-D) The semi-quantitative protein result of the Western blotting analysis. Data were expressed as Mean±SD. * P<0.05 vs Control group (each group n=4-5). CeA150, CeA300 and CeA600 represented groups with CeA 150, 300 and 600 mg/Kg Body weight treatment

