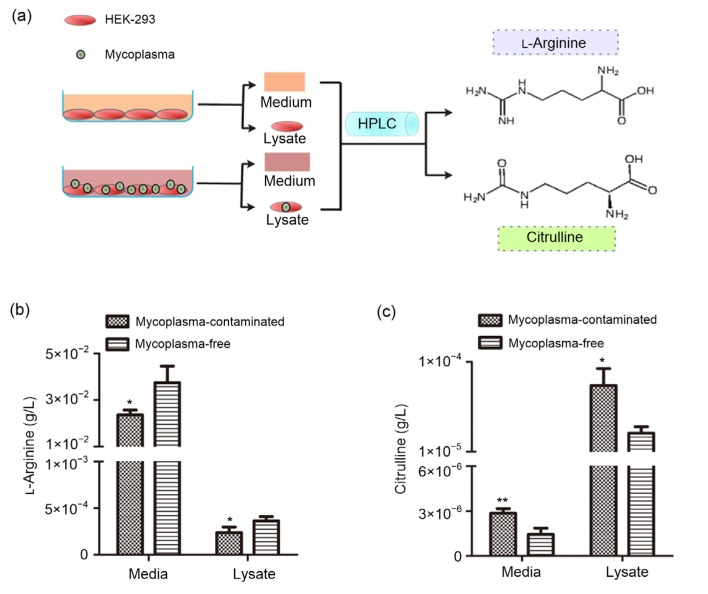
Fig. 3.
Identification of L-arginine consumption and citrulline accumulation in mycoplasma-contaminated HEK-293 cells
Schematic representation (a) of measuring the concentrations of L-arginine (b) and citrulline (c) in both cell media and lysates from mycoplasma-contaminated and mycoplasma-free HEK-293 cells. Data are expressed as mean±standard deviation (n=3). * P<0.05, ** P<0.01, vs. mycoplasma-free cells

