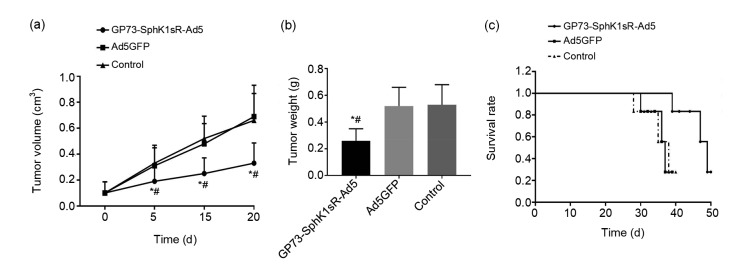
Fig. 5.
Tumor growth in the Huh7 xenograft mouse model
(a) Tumor volume at 0, 5, 15, and 20 d after injection. (b) Tumor weight at 20 d after injection. (c) Survival rate. GP73-SphK1sR-Ad5, mice intratumorally injected with 6×10⁸ plaque-forming units (PFU) of GP73-SphK1sR-Ad5; Ad5GFP, mice intratumorally injected with 6×10⁸ PFU of Ad5GFP. Control, mice intratumorally injected with phosphate-buffered saline (PBS). Data are expressed as mean±standard deviation (SD), n=10. Comparisons were made by one-way analysis of variance (ANOVA). * P<0.05, vs. Ad5GFP group; # P<0.05, vs. control group

