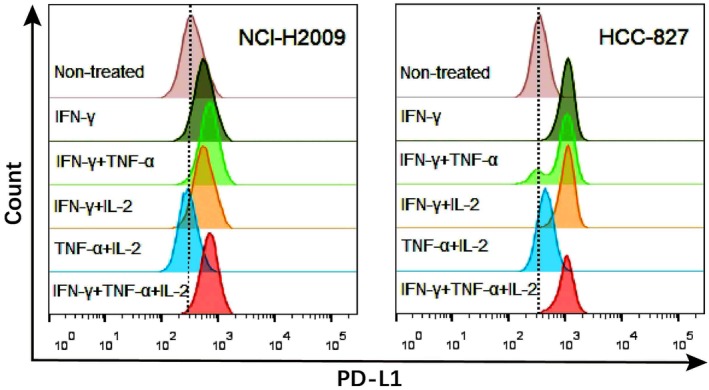
Figure 3.

Flow cytometry analysis of TNF‐α, IL‐2 and IFN‐γ synergistically‐induced lung cancer cells to express PD‐L1. NCI‐H2009 and HCC‐827 cells were cultured in 24‐well plates. IFN‐γ (100 ng/mL), TNF‐α (50 ng/mL), IL‐2 (100 U/mL) was added to each well in different combinations, respectively and cultured for 72 hours.
