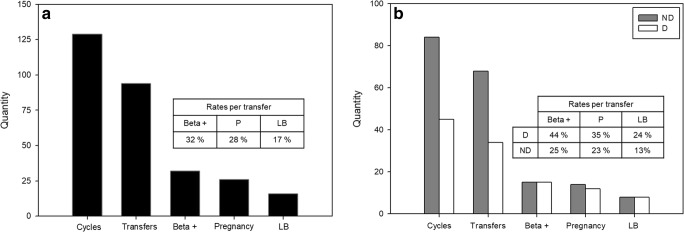
Fig. 2.
ICSI results for the overall patient population (panel a, n = 129) and for donor (D; n = 45, white bars) and non-donor (ND; n = 84, gray bars) cycles (panel b). Beta +, clinical pregnancy, and live birth rates (LB) are expressed per transfer. There were no significant differences in ICSI success measures (Fisher’s exact test) between donor and non-donor cycles

