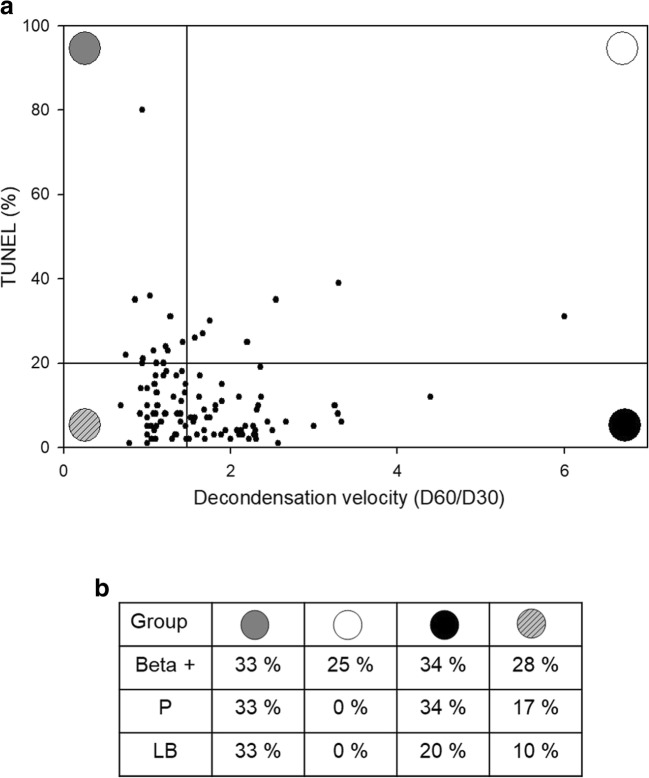
Fig. 7.
Panel a TUNEL and D60/D30 values in individual patients. Individual patient values for TUNEL and D60/D30 were plotted against each other. Four groups of patients were identified based on cutoff values for each parameter: (i) TUNEL+ FastD (n = 9, upper left quadrant), (ii) TUNEL+ SlowD (n = 7, upper right quadrant), (iii) TUNEL− FastD (n = 40, lower left quadrant), and (iv) TUNEL− SlowD (n = 44, lower right quadrant). Panel b ICSI success data for patient groups defined in panel a. Beta +, clinical pregnancy (P), and live birth rates (LB) are expressed per transfer. There were no significant differences in ART measures between patient groups (Fisher’s exact test). Gray circle: TUNEL+ FastD. White circle: TUNEL+ SlowD. Striped circle: TUNEL− FastD. Black circle: TUNEL− SlowD

