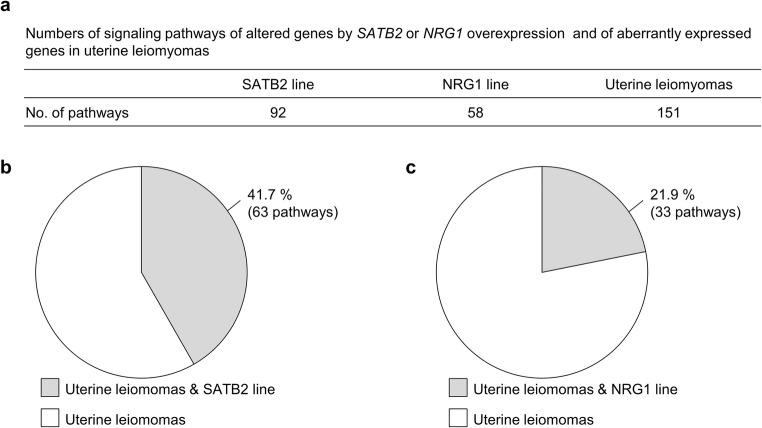
Fig. 4.
Pathway analysis of genes with altered expressions in the hTERT UtSMC lines overexpressing SATB2 or NRG1 and uterine leiomyomas. a Numbers of signaling pathways of the altered genes in SATB2 line, NRG1 line, and uterine leiomyomas. Canonical pathways were analyzed with Ingenuity Pathway Analysis (IPA) software. Pathways with p values below 0.05 were selected. b Percentage of pathways altered by SATB2 overexpression in the pathways activated in uterine leiomyomas. Gray region indicates the percentage of the pathway common to the SATB2 line and uterine leiomyomas. White region indicates the percentage of the pathway exclusively in uterine leiomyomas. c Percentage of pathways altered by NRG1 overexpression in the pathways activated in uterine leiomyomas. Gray region indicates the percentage of the pathway common to the NRG1 line and uterine leiomyomas. White region indicates the percentage of the pathway exclusively in uterine leiomyomas

