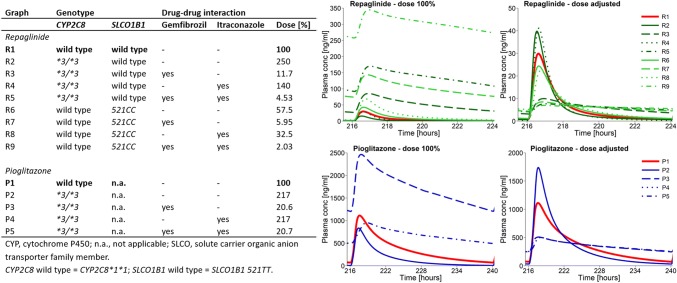
Fig. 6.
Dose adjustments developed with the physiologically based pharmacokinetic models for repaglinide (upper panel) and pioglitazone (lower panel). Predicted plasma concentration–time profiles are shown for European male CYP2C8 and SLCO1B1 wild-type individuals (red lines) as well as for CYP2C8*3/*3 or SLCO1B1 521CC individuals (repaglinide: green lines, pioglitazone: blue lines) before or during perpetrator drug coadministration. The left-hand plots show predicted plasma concentrations without dose adjustment; the right-hand plots show predicted plasma concentrations with dose adjustment. conc concentration, CYP cytochrome P450, n.a. not applicable, SLCO solute carrier organic anion transporter family member

